

Here’s weekly all-cause mortality, New York City, 2015-2025.
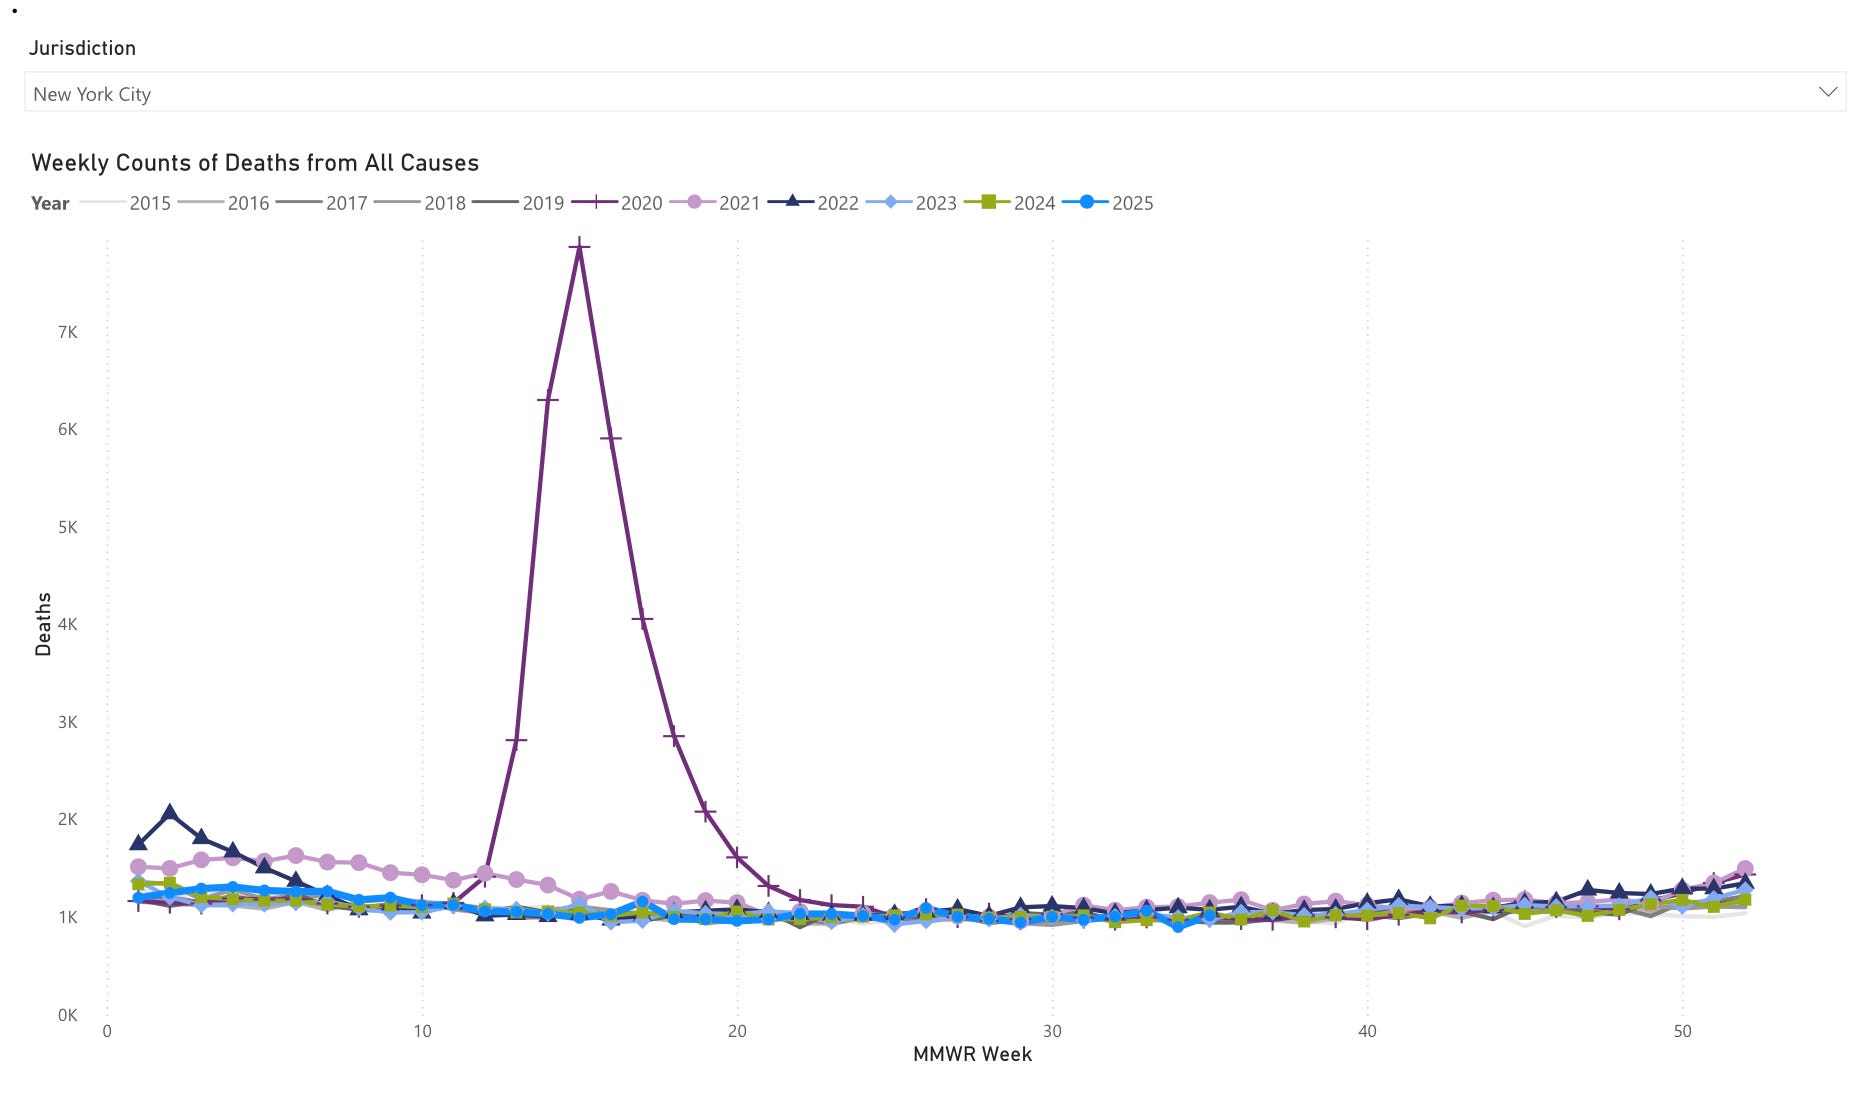
Source: https://www.cdc.gov/nchs/nvss/vsrr/covid19/index.htm
Were I teaching a class, I would begin by displaying this graph and asking the students to huddle with two people nearest to them and generate a list of five observations and five questions about it.
This isn’t a class, but the open comment board is a good place for anyone who sees this to do so.
It's a fake.