

The "Covid Death" Reckoning
The "Covid Death" Reckoning
My analysis of some of the newly-released covid-19 data from New York State and New York City's 2020 vital statistics reports


We hunt the cause of ruin, add,
Subtract, and put ourselves in pawn;
For all our scratching on the pad,
We cannot trace the error down.
—From “The Reckoning” by Theodore Roetke
I’m happy to say that a long-awaited data reckoning has begun.
Two New York agencies have released reports that change their claims about how many “covid deaths” occurred in 2020 and validates critics who’ve said such deaths were overcounted.
The New York State Department of Health and New York City Department of Health & Mental Hygiene published their respective 2020 vital statistics reports on April 7, more than three years after the Covid Era began.
My take on finalized covid-19 data in these reports is different from that of Empire Center’s Bill Hammond, whose article I incorporate and address in this post.
I framed my analysis of the newly-released data with three questions:
How many New York & New York City1 residents, respectively, died in 2020, from all causes?
How many of those 2020 deaths are attributed to covid-19?
Where did the deaths attributed to covid-19 occur?
My data sources are
New York State Department of Health Vital Statistics of New York State 2020 - This includes the state’s official annual morality report. Data aggregated from New York resident death certificates. Release date: April 7, 2023.
New York City Department of Health & Mental Hygiene (NYC DOHMH)’s Summary of Vital Statistics 2020 - An annual report focused on the five boroughs/counties that comprise New York City proper: Bronx, Kings, Manhattan (New York Co.), Queens, and Staten Island (Richmond Co.). Also released on April 7, 2023.
CDC WONDER - The official federal mortality warehouse for the United States, where all death data for states and counties are kept. Certain portions are restricted and require special-use permissions, but basic searches are accessible to the public. The mortality experience in a calendar year is provisional until being finalized in December of the following year.
Two databases within WONDER include Underlying Cause of Death (UCoD) and Multiple Cause of Death (MCoD). UCoD uses the “topline” cause of death, i.e., only one primary cause, whereas MCoD shows causes of deaths regardless of where they appear on the death certificate. For example, a query for covid-19 in the UCoD database shows deaths for which Covid-19 is listed as underlying cause. A query for covid-19 in the MCoD database shows deaths for Covid-19 is listed as either underling cause or a contributing/secondary cause. UCoD is organized by state or county of residence. MCoD searches residence too, but can also be queried by state of occurrence.
The National Center for Health Statistics/CDC Provisional Death Counts for Coronavirus Disease website is another federal source, created in spring 2020. It receives data from the National Vital Statistics System for deaths occurring withing the 50 states and D.C. Data are subject to a 1-2 lag and are not considered “final.” Per a CDC staffer, the data on this webpage includes non-U.S. residents, while WONDER is only U.S. residents. The reason I included this source is because Bill Hammond uses it – not WONDER – in his article.2
See footnotes for the data compiled from each source.3
How many New York & New York City residents, respectively, died in 2020, from all causes?
There’s general agreement between state and federal sources on total all-cause deaths, with a few notable discrepancies. (Table 1)
Table 1: All-Cause and Covid-Attributed Deaths Reported for New York State and New York City Across Sources
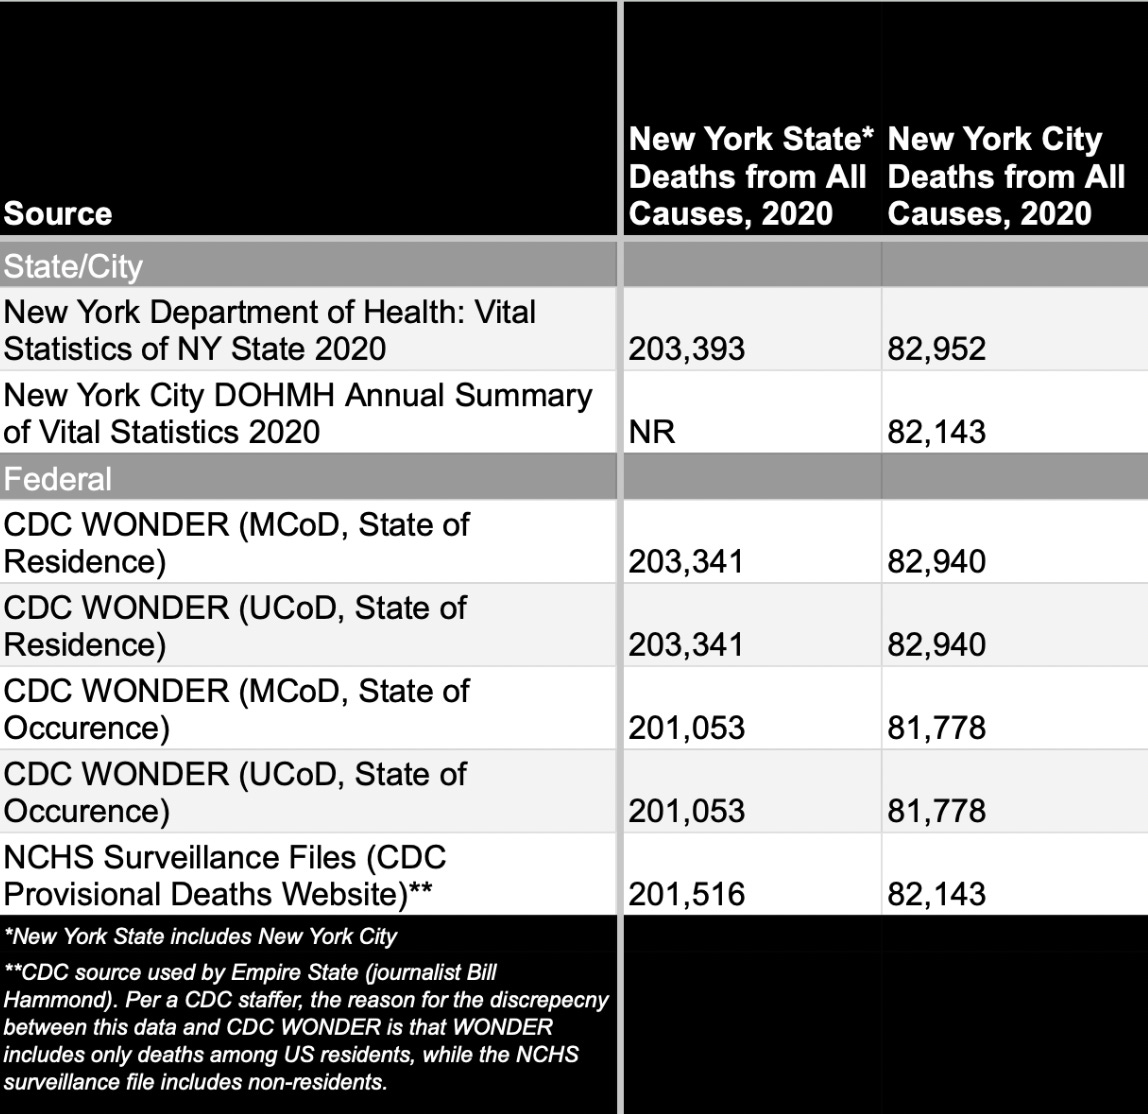
New York State (NYS) says 203,393 New Yorkers died in 2020, which is close to the 203,341 in CDC WONDER (for residents).
But NYS shows New York City had 82,952 deaths, which is 809 deaths higher than the 82,143 in the NYC Vital Statistics report. This could be explained by NYC residents dying in counties outside of the five boroughs, i.e., being brought to a hospital in Westchester County.
The difference between CDC WONDER’s state of occurrence and state of residence numbers suggests something similar, i.e., that ~2,200 New Yorkers died in another state. Because 50% appear to have been New York City residents, that may suggest a good number of people living in the metro area died in Connecticut or New Jersey in spring 2020.
Finally, we see that the NYC vital statistics all-cause number (82,143) matches the NCHS surveillance data number for the city exactly, which is curious, given NCHS includes non-U.S. residents. I’m not sure what to make of that, or why the number is 797 deaths lower than the 82,940 for all-cause deaths CDC WONDER shows for the five boroughs.
How many of New York State/New York City 2020 deaths are attributed to covid-19?
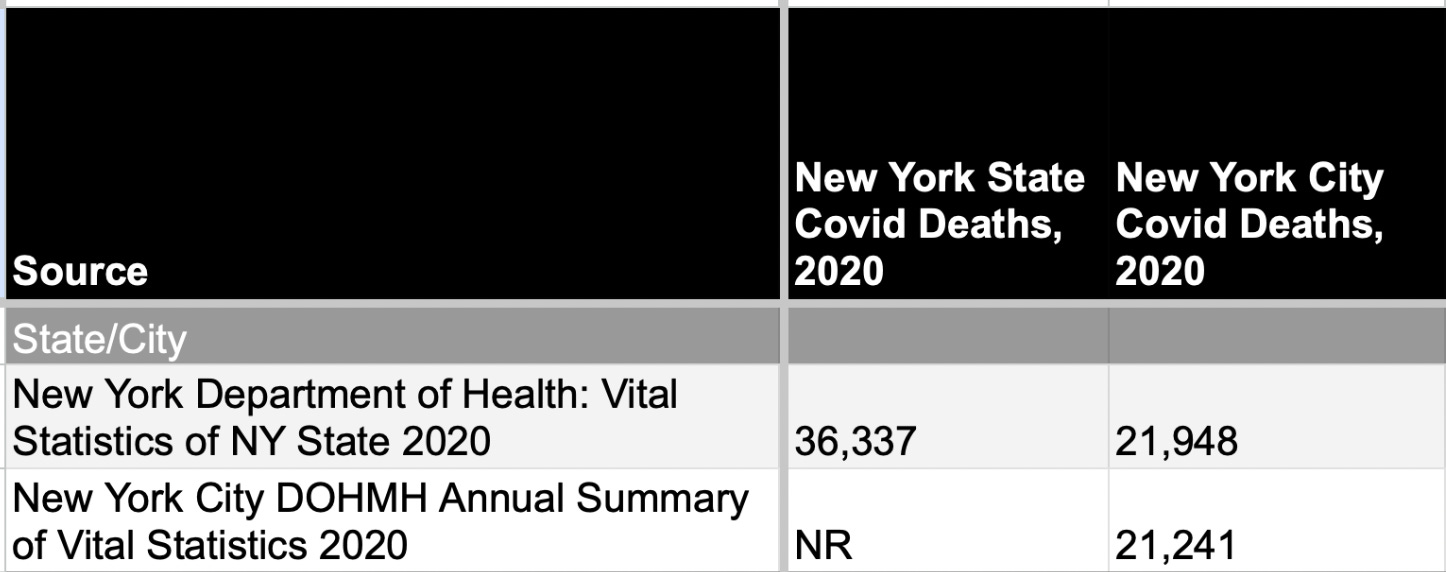
New York state and New York City don’t agree on the covid-19 death total for NYC, with the state showing 707 more covid deaths (Table 2). Like the all-cause difference, this could be due to NYC residents dying in another county.
Table 1: Number of Covid-19 deaths in New York State and New York City, per state & city vital statistics reports
But the most revealing part of NYC’s vital statistics report is on page 66, in a “Special Section on Covid-19 Mortality.”

Here, NYC DOHMH says its website previously had shown 24,629 covid deaths --
19,224 of these were “confirmed,” which meant testing positive on a PCR test, having covid-19 on the death certificate, or dying within 60 days of their lab result (meaning unclear), no matter what other causes of death were listed, external causes excepted (e.g., car accident).
5,405 were “probable,” which meant covid-19 was on the death certificate but there was no lab-confirmed positive test.
The agency then says those numbers aren’t the basis of the 2020 morality report.
Instead, they used 21,241 -- the number of deaths that attribute covid-19 as underlying cause, with World Health Organization’s definition applied, which is test-centric.
The 21,241 is close to the 21,393 deaths that attribute Covid-19 as underlying cause in CDC WONDER. So, it seems NYC DOHMH is trying to get on the same page as the Feds.4 To be fair, a Test-Result-Equals-Covid-Death approach was apparent from the start. See, for example, the CDC’s language in a May 2020 mortality estimate for New York City.
NYC DOHMH explains the prior over-ascertainment as a function of lack of guidance, lack of testing, and pressure to report how much of the mortality spike in spring 2020 was covid.
With the beginning of the COVID-19 pandemic, the NYC Health Department implemented several measures to ensure complete ascertainment of COVID-19 deaths, as adequate nosology guidance did not exist, doctors did not necessarily know how to complete the cause of death section on the death certificate, and testing for the disease was extremely limited. To ensure the best possible ascertainment, the team worked very closely with the NYC DOHMH ICS/Surveillance Epidemiology team to monitor cases, including matching lab records of COVID-19 tests with the death registry. This allowed real-time reporting of COVID-19 deaths in a time when total deaths were increasing rapidly.
These reasons make little sense, given where and how much testing was being done, and all-cause mortality that didn’t begin to rise until March 18.
On the upside, city health officials seem to be saying their “final” covid death numbers don’t include deaths that didn’t have a PCR-positive test for SARS-CoV-2 – which a step in the right direction toward reclassifying deaths blamed on covid-19.
On the downside, the deaths of 21,241 New York City residents are being attributed to a novel respiratory virus largely, if not entirely, because of a positive test result, as long as the death was from natural causes. An absurd assertion remains: The sudden spread of a deadly novel respiratory virus is responsible for 80% of the ~27,000-death spike.
NYC DOHMH doesn’t show monthly or weekly numbers in its report (which we wouldn’t expect in a calendar-year summary). But they also don’t make clear that most covid-attributed deaths in 2020 occurred in a little over two months.
Allow me to illustrate, via weekly all-cause mortality from WONDER, for January 2018 through December 2020 (Graph 1).
Graph 1: New York City Weekly All Cause Mortality, January 2018 - December 2020

Deaths went up – then way, way up -- in the wake of government & public health officials urging or ordering people to stay home. Approximately 70% of a full year’s mortality occurred between St. Patrick’s Day and Memorial Day. Just as shocking is the sudden drop back to baseline, where it stayed until the last weeks of December. The Government narrative was - and still is — “the virus hit New York harder” and “New York got the virus under control.” Exceptionalism on steroids, complete with accolades for legitimately traumatized healthcare workers and an illegitimate Emmy for Andrew Cuomo.
Incredibly, 90% of New York City resident deaths in 2020 that are blamed on covid-19 occurred between March 15th and May 30th (19,323 out of 21,393, per WONDER). Graph 2 shows weekly deaths that list covid-19 as underlying cause versus deaths that don’t.
Graph 2: New York City Weekly Deaths, January 2018 - December 2020: Deaths Attributed to Covid-19 and Deaths Not Attributed to Covid-19

With NYC DOHMH washing its hands of generous counting strategies, “But missed covid deaths!” no longer holds water.
Perhaps mortality stats veterans in the agency can see what I see: A pattern resembling a mass casualty event wrought by non-natural forces – not a new, super-spreading deadly virus.
In his April 14 article, “The Health Department Releases a Fuller Account of COVID’s Deadly First Year”, Empire Center’s Bill Hammond observes that federal data show one covid-attributed New York death in late January 2020, and several in February, “Those deaths, if verified, would dramatically rewrite the timeline of New York's pandemic.”
He’s right, but it goes beyond New York. The NCHS file Hammond is referencing shows January and February 2020 deaths in California, Georgia, Kansas, Louisiana, Mississippi, North Carolina, Oklahoma, and Wisconsin. (Image of weekly U.S. totals in early 2020 below.)

Mark my words, dear readers: We are quickly approaching a day when those *early* deaths attributed to a *novel* pathogen, alongside things like the Red Cross serology study; Pike County, Ohio antibody results; alleged phone calls from Seattle flu study researchers; summer 2019 oddities (EVALI cases/deaths, Virginia nursing home respiratory illness outbreaks, Fort Detrick lab closure), and purported disappearance of flu will need to be more fully explained. The earlier something later named SARS-CoV-2 was circulating in the U.S., the less it appears deaths attributed to “covid-19” were the result of sudden spread of a deadly virus, no matter whence it came.
Where did New York/New York City resident deaths attributed to covid-19 occur?
Elsewhere, I’ve shown that the majority of excess mortality in New York City occurred in hospitals and at home — not in nursing homes, as implied by government officials and mainstream media.
Bill Hammond says the differences between NYS’s previous 2020 covid-19 total due to “more than 6,000 victims who were left out of the state’s previous tallies because they died at home” because the state “disclosed pandemic data drawn from death certificates rather than its Health Emergency Response Data System, or HERDS.”
Hammond doesn’t quote NYS officials, and I don’t see that explanation in the state’s report, but I may be overlooking it. Regardless, both the NCHS surveillance file and CDC WONDER have always shown place of death for all deaths attributed to covid-19.
Taking the numbers Hammond is using, we see a 4,000-death difference between the number of covid deaths NY DOH says occurred at home and federal sources (Table 4).
Table 4: Source Comparison of Covid-19 Deaths Occurring at Home in New York State and New York City

Additionally, WONDER shows all places of deaths for the state and city. NYC DOHMH does as well (Table 5).
Table 5: New York State and New York City 2020 Deaths Attributed to Covid-19 by Place of Death

I can’t reconcile these sources with the 6,283 and 4,441 (in New York and New York City alone, respectively) covid-19 deaths at home that Hammond reports.
Federal and New York Place of Death definitions for “Home” and “Other” do differ somewhat – and leave a bit of wiggle room - but the WONDER and DOHMH numbers for covid-attributed deaths at home aren’t much different. The outlier is the state & city numbers Bill Hammond says were deaths at home.5
More importantly, nothing changes the number of New York City residents who died in hospitals, or that over 15,000 “extra” people died in hospital inpatient, emergency rooms, and outpatient in two months. To date, there has been no call for an inquiry or investigation into what exactly occurred in those hospitals.
Takeaways
My takeaways from a first pass at covid-19 data and definitions from New York State and New York City for 2020?
It’s concerning - and inexcusable - that are still discrepancies between & within NYS, NYC, and CDC WONDER. Those need to be resolved or explained as soon as possible.
It seems New York officials are trying to use non-hospital places of death as a way of minimizing or obscuring the fact that most 2020 excess death in New York City occurred in the spring and in hospitals. Why? Some independent analysts - me, Michael Senger - have suggested that much, if not all, of the excess deaths in NYC city hospital were iatrogenic. Without patient chart review by a respected third-party, or a class-action law suit, we’ll never know for sure. It’s worth considering who all might have an interest in Americans never knowing.
The new vital statistics reports do take baby steps toward honest ascertainment of causes of death during both that event, and the three-year “pandemic,” but the agencies either don’t grasp or don’t want to acknowledge how much of an outlier NYC really was, how deadly the policies & protocols implemented were, and what the magnitude of all-cause & covid-attributed mortality suggests about the validity of claims about SARS-CoV-2’s infection fatality ratio. No one can deny that New York City’s 11-week death spike in spring 2020 was a mass casualty event unlike anywhere in the world (though possibly akin to the Northern Italy experience).
The reports and the general public acknowledge that non-Covid excess occurred. But there’s little to zero motivation to see where a hypothesis that no excess is from a deadly novel virus leads. As more research-minded people weigh this possibility, such an investigative stance can no longer be considered “fringe”— at least not by those who cares about data integrity and the devastating impact of pandemic-response policies around the world.
Finally, the notes and definitions in the NYC vital statistics report seem to signal that the federal government’s “official” number of “covid-19 deaths” in 2020 are deaths in CDC WONDER that list covid-19 (emergency use code U07.1) as underlying cause. I assume - perhaps incorrectly - that deaths which list covid-19 as a contributing (multiple) cause are not considered “covid deaths” by federal officials. Journalists, state & local public health/elected officials, and researchers should take note, and ask the CDC if that is the case.
There’s a long way to go, to be sure, but I believe The “Covid Death” Reckoning has begun.
Readers can access my other Substack articles on New York’s 2020 mortality event here:

In this post and for all datasets referenced, New York City = All 5 Boroughs/Counties = Bronx, Brooklyn (Kings Co), Manhattan (New York C.), Queens, Staten Island (Richmond Co).
Hammond includes data previously reported by the NYC Covid Tracker. I do not, but in February, I posted a graph showing discrepancies across data sources re: the number of covid-attributed deaths in the city during spring 2020.

The gap between the number of covid deaths New York state DOH is reporting and the CDC WONDER Underlying Cause number is almost entirely explained by the NYC’s gap with WONDER
I have questions in general about the sequence of events involved in a person dying from covid-19 at home. Some of my logic around that can be seen in this thread.
Thanks for keeping the focus on the murderous politics and the resulting iatrogenic mass casualty. As any Dr. with vestigial conscience can plainly see, corporate and institutional medical care in NYC has gone from abominable to atrocious. They blame it all on "Covid" but I am also convinced this was an epic slaughter by the best healthcare in the world. Utterly shameful and disgusting.
March 24, 2020 — CDC issues an official guidance memo titled "CDC Alert 2" changing the rules for reporting deaths, suspending previous guidelines for the first time in 17 years, allowing many causes of mortality to be counted as "COVID-19" as the underlying cause, regardless of the actual cause.
94% of deaths will be shown by CDC data to have on average four additional serious underlying causes of mortality. This single-page release would define how Covid-19 deaths would be categorized and counted and begin a process by which all manner of deaths would be coded as U07.1 COVID-19.
This will lead to the wholly manufactured "Covid death" tally.
Shortly thereafter the WHO, on April 16th, 2020, would release its own document titled, “International Guidelines for Certification and Classification (Coding) of Covid-19 as Cause of Death.”
The WHO’s guidelines would define a Covid-19 death as, “a death resulting from a clinically compatible illness, in a probable or confirmed COVID-19 case, unless there is a clear alternative cause of death that cannot be related to COVID disease.”
The guidance goes on: “A death due to COVID-19 may not be attributed to another disease (e.g. cancer) and should be counted independently of preexisting conditions that are suspected of triggering a severe course of COVID-19.”