How Busy Was the Elmhurst Hospital Emergency Department in Spring 2020?
A long & winding road to finding out...
I said in the previous Elmhurst Hospital post that the next Elmhurst post would be about why I doubt the hospital’s 2020 death curve is true. That post is delayed because I’m waiting on responses to a related records request.
In the meantime, I describe the long & winding road toward answering the basic question of how busy Elmhurst’s emergency department was in spring 2020.
This is another chronicle about difficulties obtaining basic data related to the New York City spring 2020 death spike — specifically, Elmhurst Hospital emergency department visits.
It’s a rather strange and exhausting trip because I thought I’d obtained what I needed, realized I was mistaken, see discrepancies between datasets provided by the same agency, and am still having trouble getting numbers in the desired increment & span.
The driving questions are
How busy was the “epicenter of the epicenter” Elmhurst Hospital emergency department in spring 2020?
Was it as busy as media and elected officials portrayed?
Was it busier than it had ever been?
Was it busier than NYC hospital EDs as a whole?
For readers who need a short cut, the answers as of right now are
No dataset or report I’ve found or obtained shows Elmhurst experienced record-high or overwhelming numbers of patients in the emergency department in March or April 2020.
Elmhurst’s March pattern deviates slightly from that of NYC as a whole, but not to the extent portrayed by media & officials.
Public agencies and researchers have been resistant to releasing emergency department data for Elmhurst, making it appear as though there is something to hide.
Discrepancies between datasets provided by the same agency are suggestive of “tampering” with numbers, definitional changes, or both.
It’s difficult to reconcile on-the-ground and contemporaneous reports with time series data of different kinds and from different sources, or to justify the federal government’s failure to order or conduct an inquiry into what happened at Elmhurst.
For the full “travelogue,” keep reading…
Starting Point: Daily ED Visits in All New York City Hospitals
Let’s start the journey with a reminder about how busy New York City’s hospital emergency departments (EDs) were as a system in the early days of the COVID event.
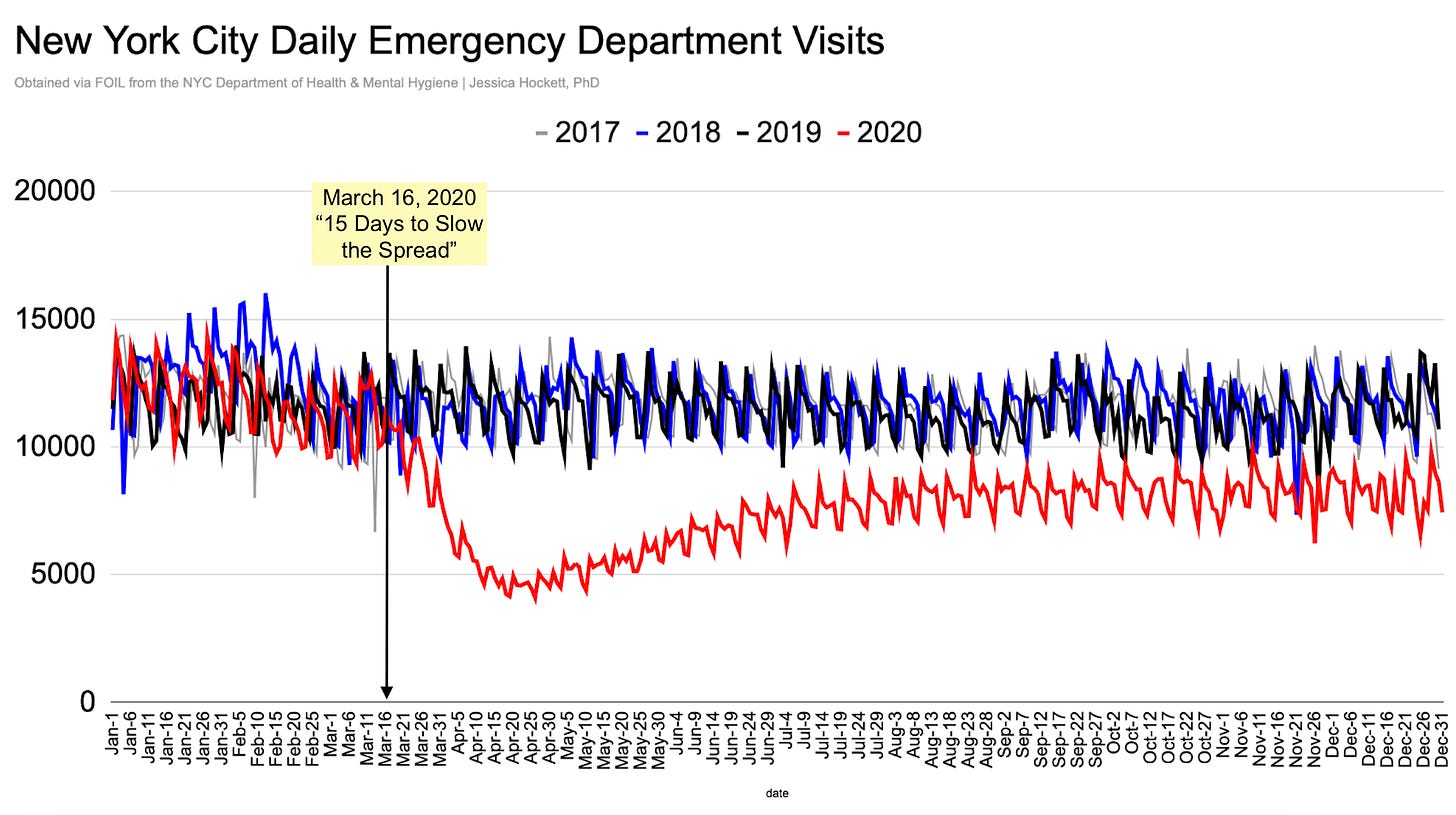
Data I obtained two years ago show ED daily visits citywide were lower in the first months of 2020 than they were in the “bad flu season” of 2018 (Figure 1). After the WHO pandemic declaration was issued and the U.S. government announced “15 Days to Slow the Spread,” visits plummeted from approximately 13,000 a day to 4,000 a day (-70%) and did not recover to normal levels until December 2021.
Figure 1
We see a pattern of lower visits on Saturdays & Sundays leading up to and following federal decrees. Reduced activity on weekends is normal in U.S. hospitals but contradicts expectations for a virus-spread/disease “outbreak” emergency, because an illness-inducing virus presumably wouldn’t know or care what day of the week it is.
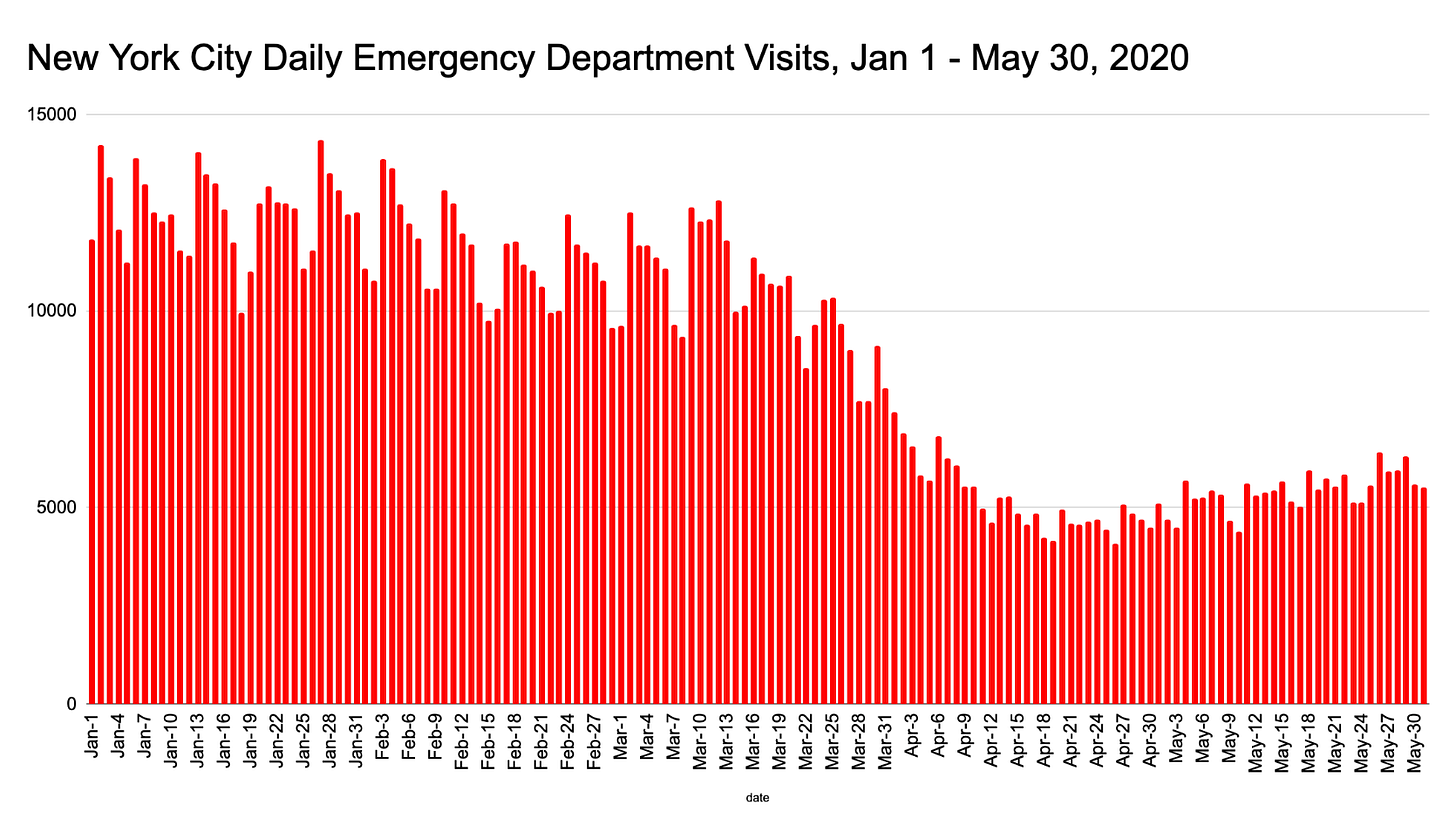
The first “case” of COVID in NYC was announced on March 1st. If the virus was already “spreading” between people for months, like Andrew Cuomo and others later claimed, we would expect to see a steady rise leading up to the city shutting down. Instead, there is no “signal” of a new illness impacting ED total visits before mid-March, after which point visits drop.1
Figure 2
First Stop: The Study
Because the public was told in March 2020 that Elmhurst was incredibly busy, we would expect its emergency department volumes to look different from those of the system as a whole.
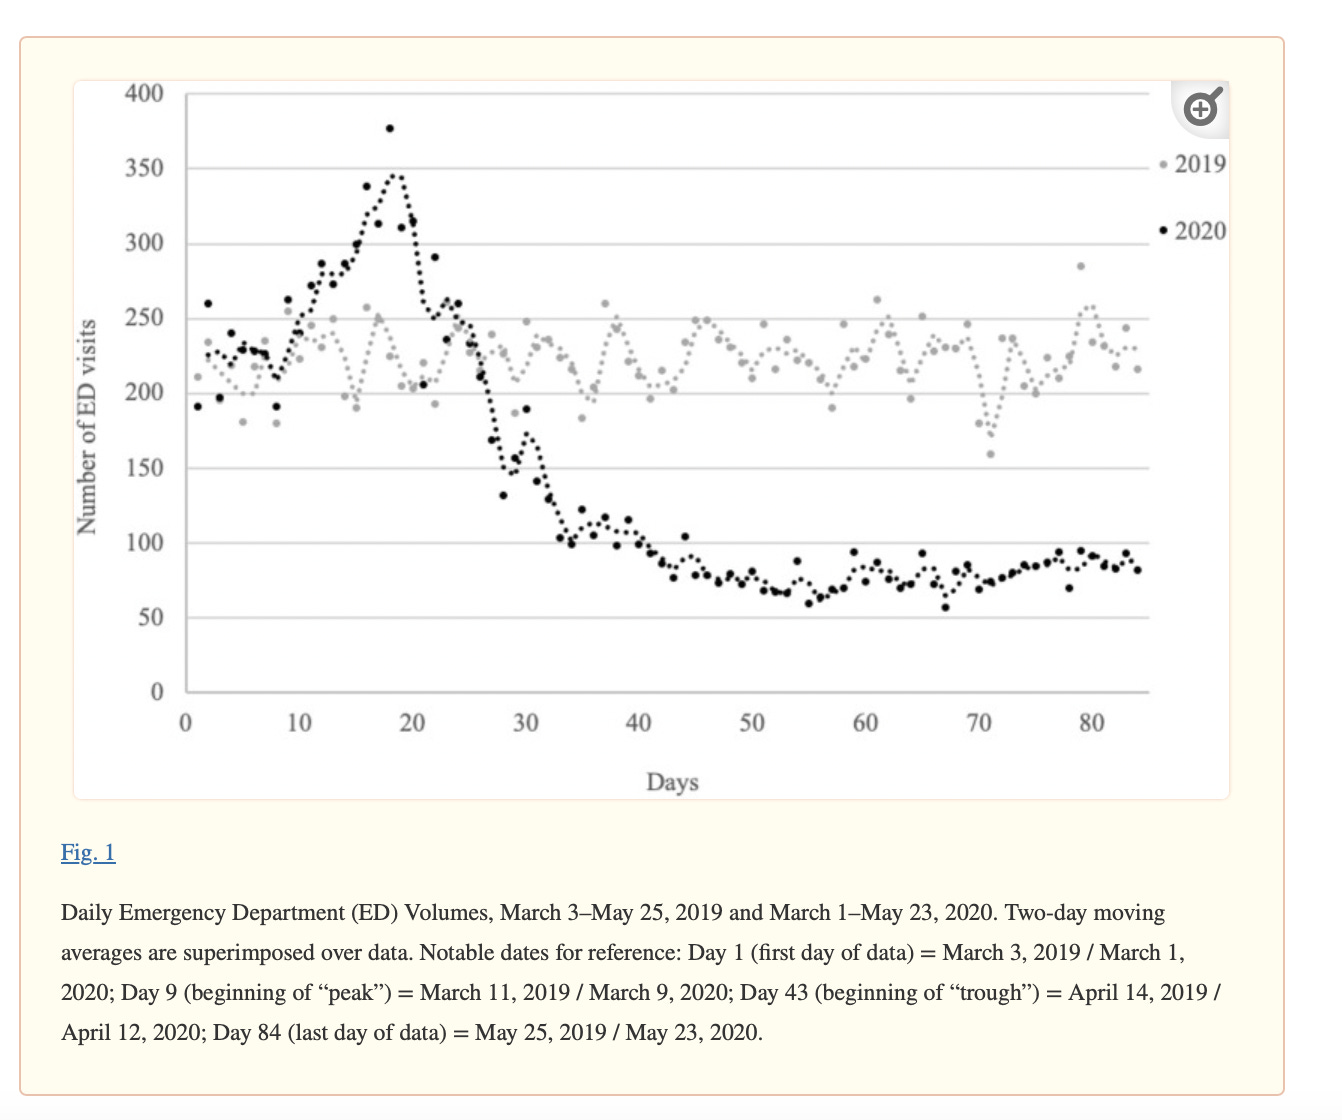
Daily ED visits for Elmhurst are reported in A Snapshot of Emergency Department Volumes in the “Epicenter of the Epicenter” of the COVID-19 Pandemic and do show a modest increase in mid-March. Unfortunately, the baseline and timeframe are insufficient for understanding how busy the ED was in relative terms.
In December 2022, I contacted Dr. Nicola Feldman, lead author on the study, and requested the raw data underlying Figures 1 and 2. Despite Dr. Feldman initially saying the data could be provided, I never received the files. (Email correspondence here.)
I’ll come back to the graphs and details from this study further down the road…
Second Stop: NYC Health + Hospitals Corporation (Quarterly ED Visits)
In January 2023, I turned to the public agency that operates Elmhurst - New York City Health + Hospitals (HHC) - and submitted an FOI request for daily emergency department visits between 1 Jan 2016 and 31 Dec 2022.
I eventually received a response saying no such records were found because HHC doesn’t maintain ED visits in a daily format. Only quarterly data were available. The relevant portion of the FOI officer’s response follows (emphasis mine):
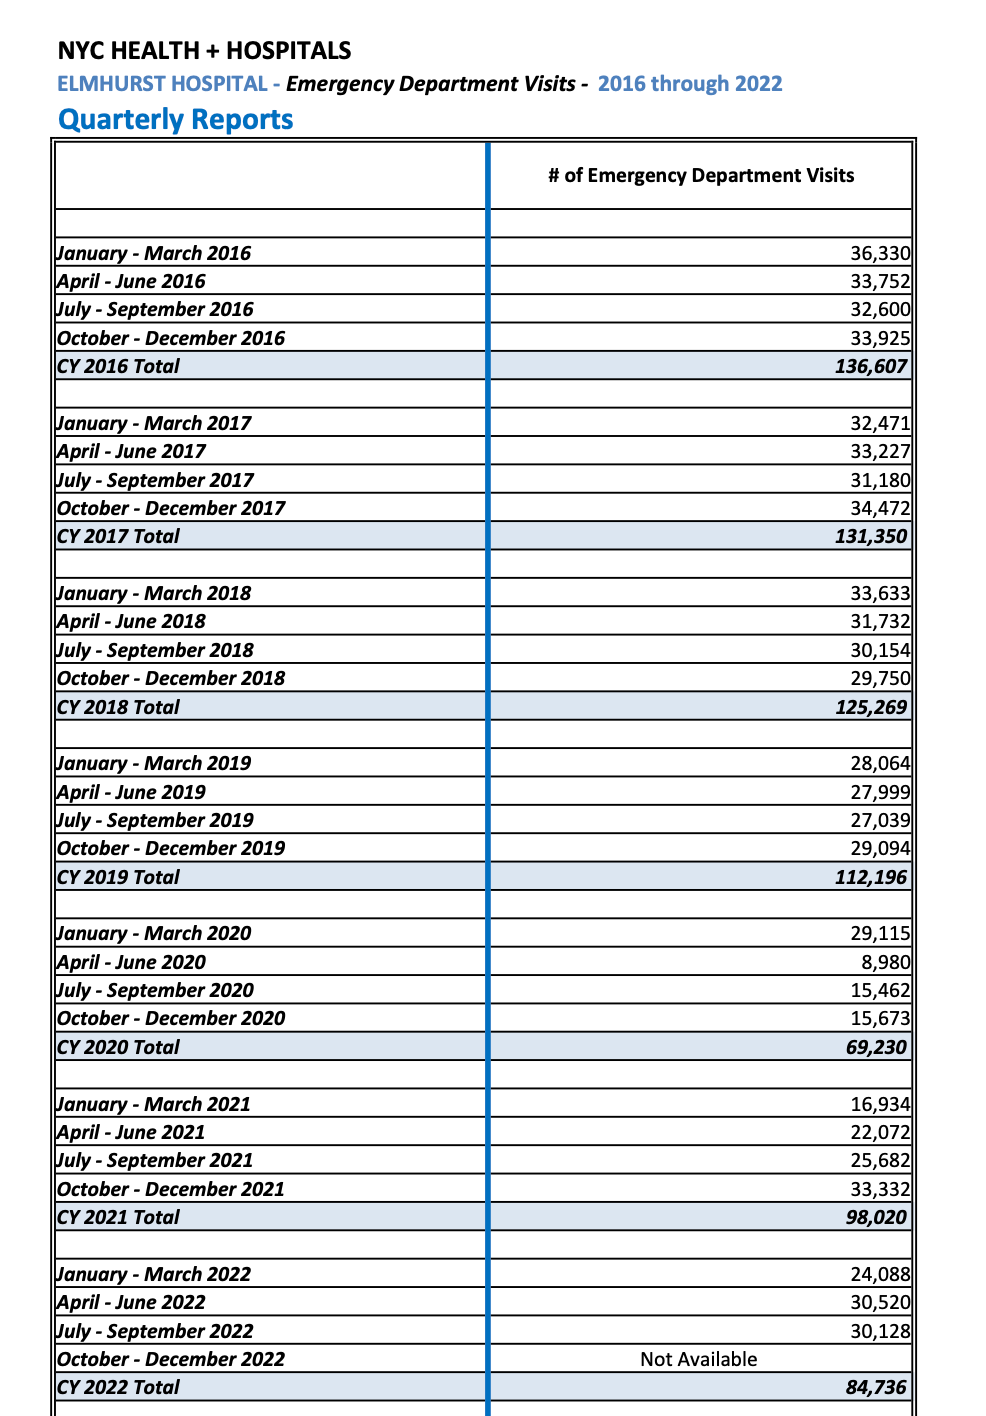
NYC Health + Hospitals performed a search for daily emergency department visits for Elmhurst Hospital, Queens, from 1/1/2016 - 12/31/2022, but no such records were found. While NYC Health + Hospitals does not maintain emergency department visits in a daily format as you requested, it does maintain records for emergency department visits in a quarterly format, and a record of those quarterly visits has been attached here. NYC Health + Hospitals has not yet summarized the last quarter of CY 2022, but data for all other quarters covering the time period requested are included in the attached.
How it’s possible - or legal - for a public hospital agency to not maintain ED visit data in a daily format I’m not sure, but because the data were made available to Feldman et al, I’m left to conclude it does exist and was being withheld for an undisclosed reason.
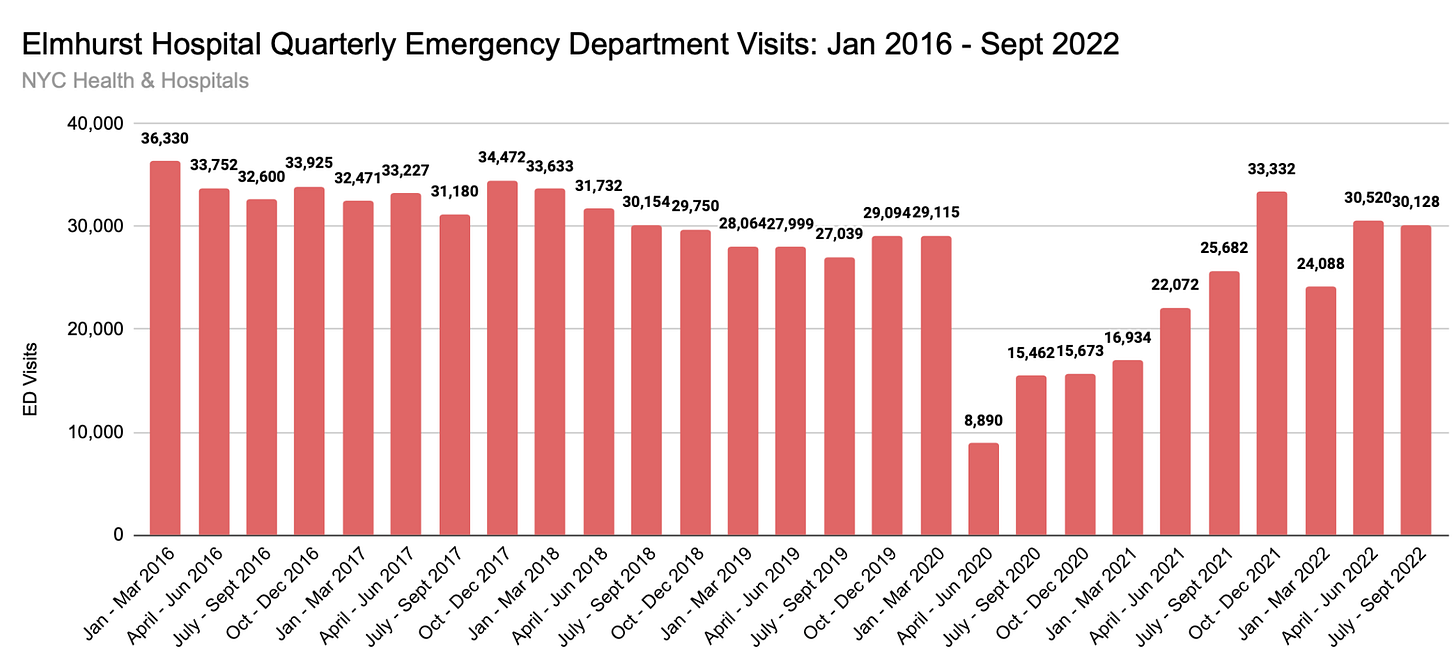
The quarterly report HHC provided shows Elmhurst emergency rooms were not experiencing relatively high volumes in either the fourth quarter of 2019 or the first quarter of 2020 (Image 1). Levels at Elmhurst dropped 70% in quarter 2, remained at ~50% below normal until quarter 2 of 2021 and didn’t return to pre-2020 levels until the last three months of 2021 (Figure 3). Nothing resembling a common-sense conception of “pandemic” was occurring.
Image 1
Figure 3
Quarterly data aren’t granular enough to determine if March 2020 saw an unprecedented burst of people rushing to the emergency department - be it seriously sick/afflicted, suffering from panic attacks, and/or worried well - but this much is clear: the flu season wasn’t seeing record-setting volumes, and the WHO pandemic declaration on March 11th didn’t send the quarterly number into the stratosphere.
Third Stop: NYC Department of Health (Daily ED Visits for Zip Code 11373)
The New York City Department of Health maintains daily emergency department visit data for each zip code. I had assumed the data represent visits to whichever hospitals are in the zip code. Because Elmhurst is the only hospital in zip code 11373, I thought it reasonable to consider the data a proxy for Elmhurst’s data.2
The public DOH file has the same problem as the Feldman et al study: It begins on 1 March 2020 (no substantive baseline).
In January 2024, I asked DOH for daily emergency department visits in zip code 11373, from 1/1/2007 - 12/1/2023. I received the data in late February and shared it on Twitter.
Bump in the Road
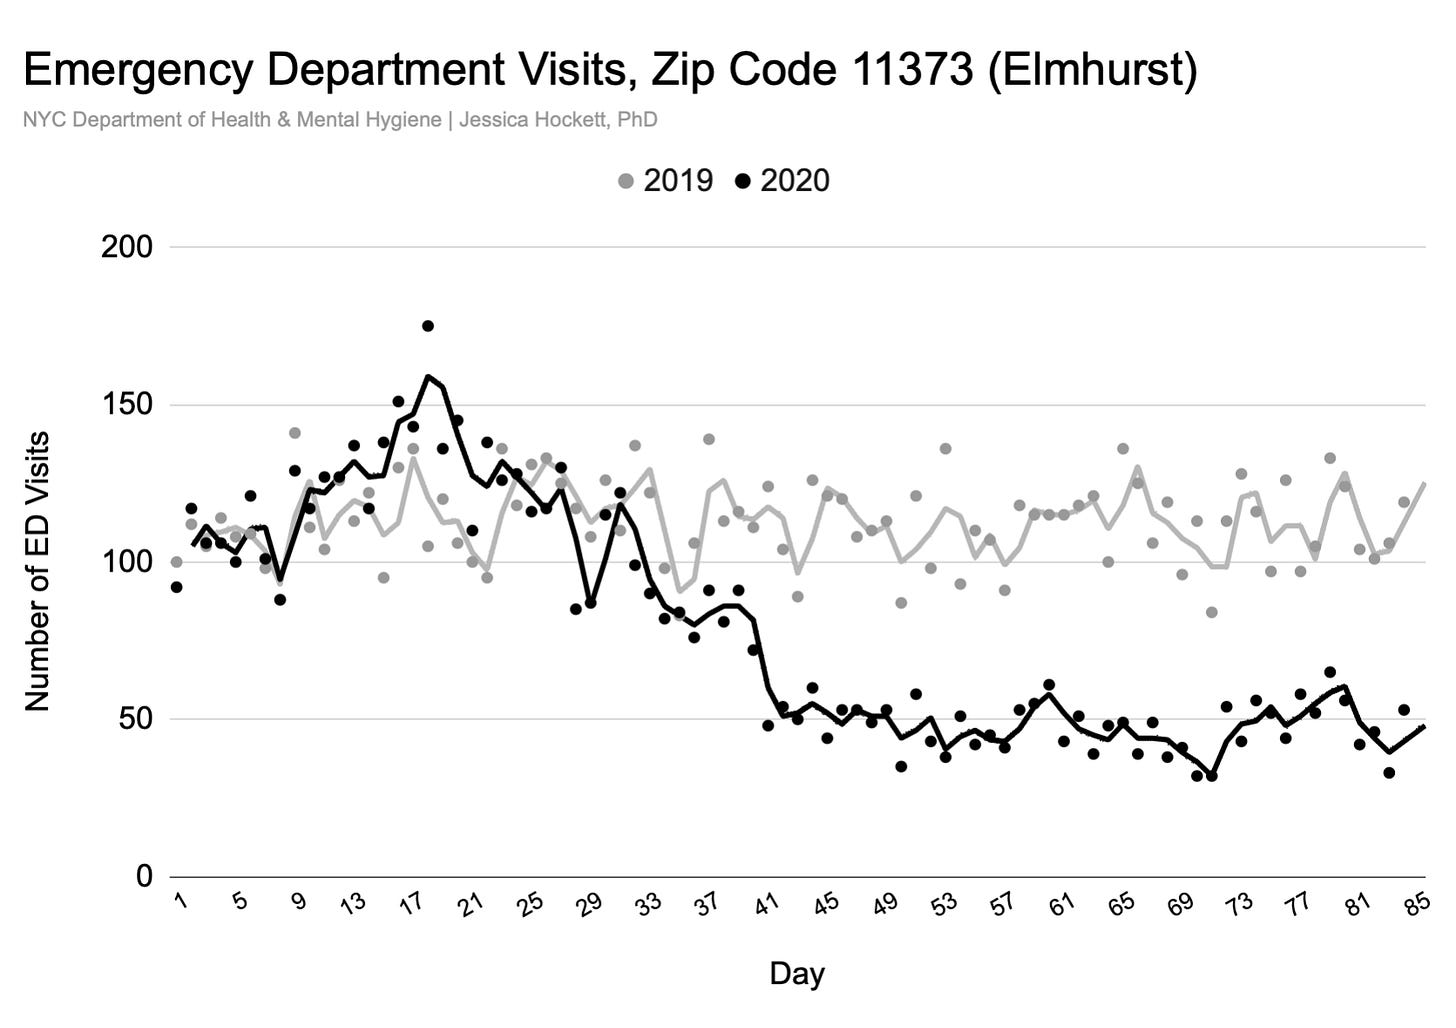
I then hit a “bump in the road”: Comparing the data I obtained from DOH with the data reported by Feldman et al, I later realized the zip code data is resident data, not hospital data.3 An email exchange with the DOH records officer confirmed this fact and means the graphs in my Twitter thread reflect the ED visits of people who live in the Elmhurst zip code (neighborhood), regardless of whether they went to Elmhurst Hospital or to another hospital in the city. Anyone who lives in another neighborhood and came or was transported to the Elmhurst emergency department is not shown.4 This may not matter for the overall trend but could make a difference for volume and magnitude.
The data I received is worth examining regardless.
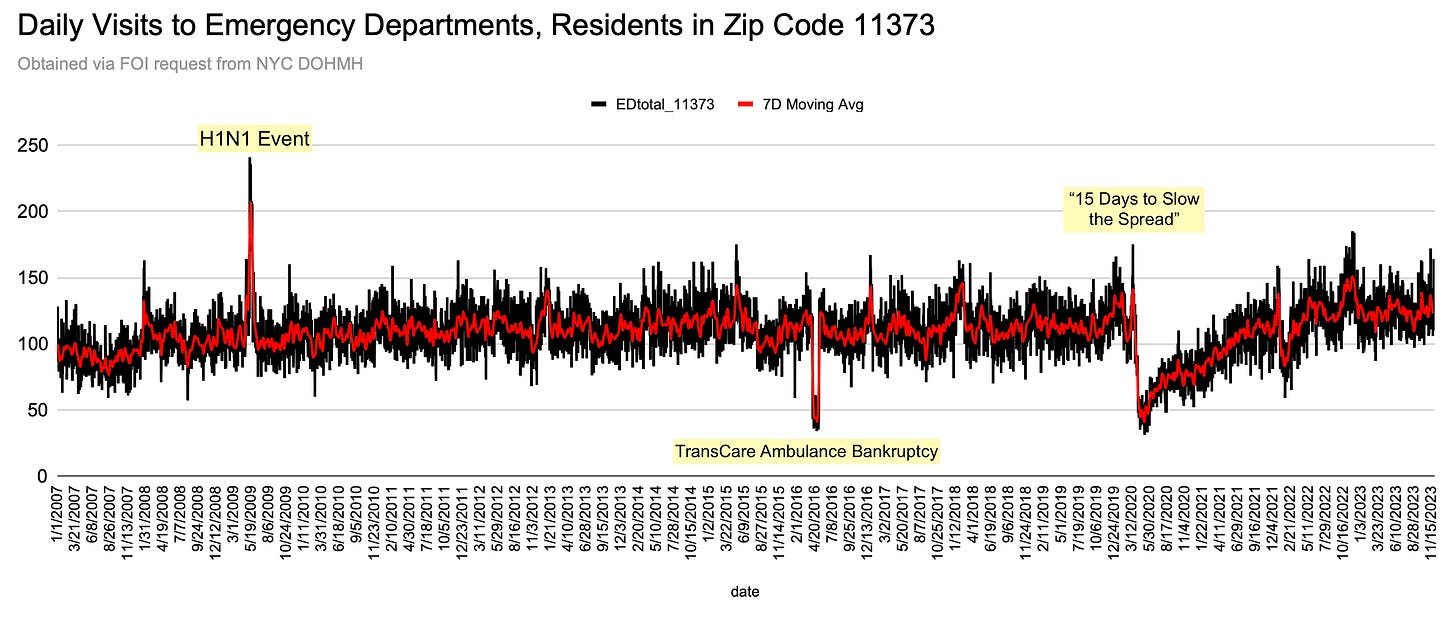
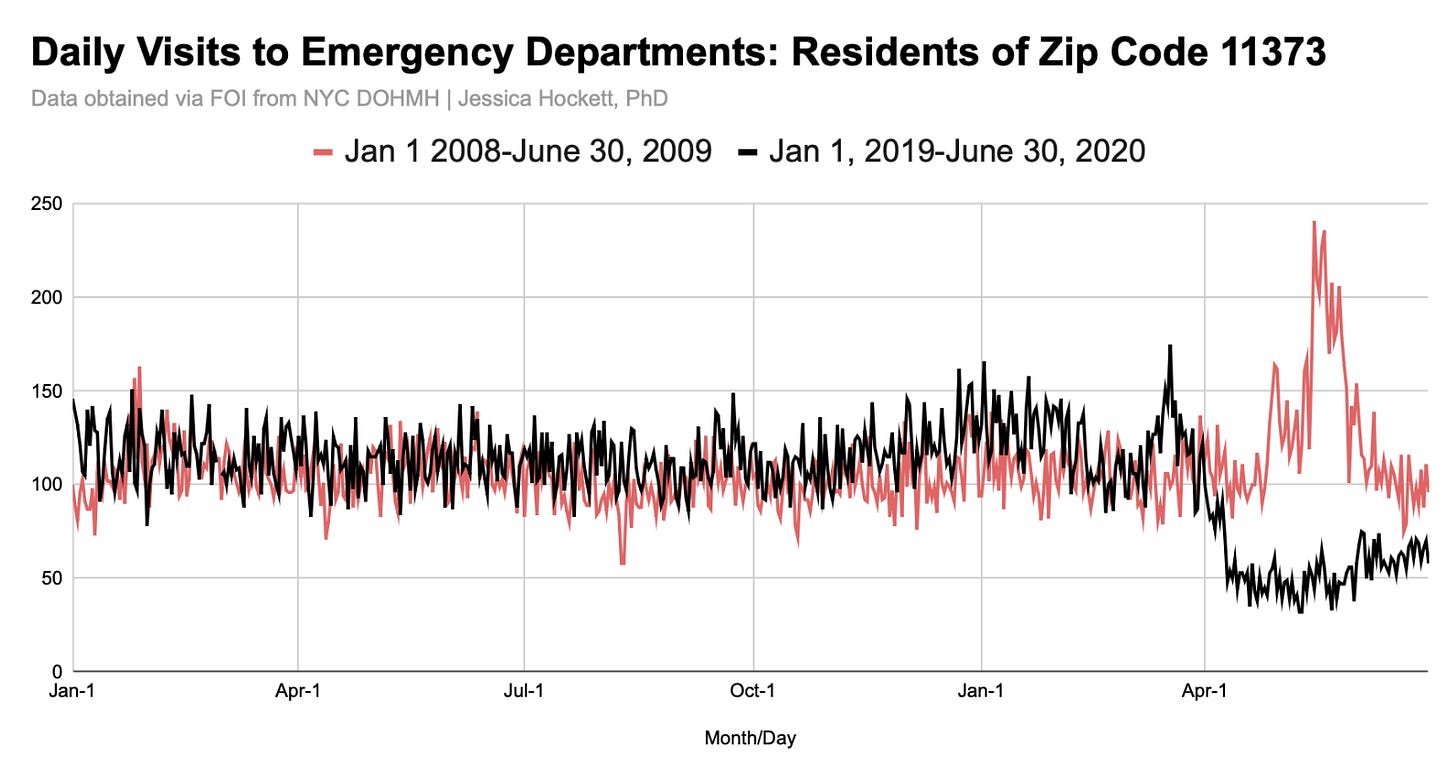
The longer timeline back to 1 Jan 2007 shows ED visits for residents living in zip code 11373 were not at unprecedented levels in spring 2020 (Figure 4). The H1N1 event peak in mid-May 2009 was 38% higher than the mid-March 2020 peak (Figure 5).5
Figure 4
Figure 5
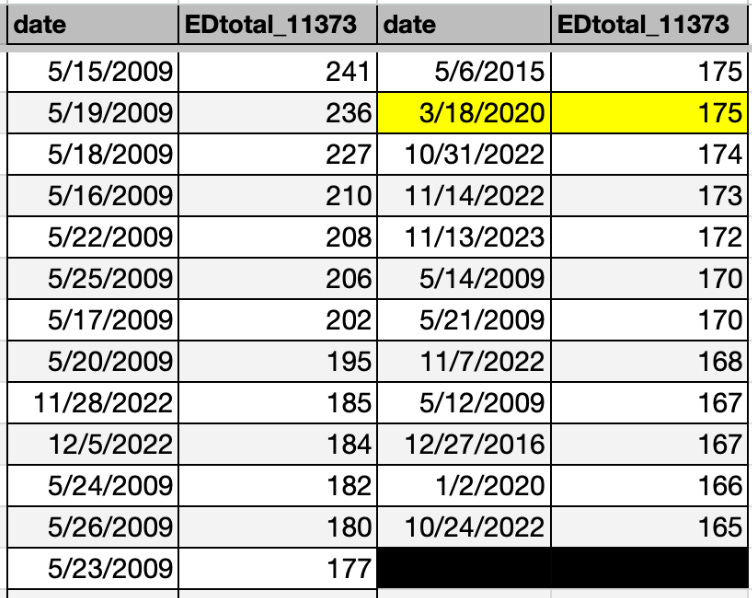
Sorting daily visits from highest to lowest shows only one day in 2020 - 18 March 2020 - in the Top 25 days with the most visits in the 16-year period (Table 1). Visit levels were higher in autumn and winter 2022 than they were in spring 2020.
Table 1
Although the residential zip code data isn’t Elmhurst Hospital’s data, it’s notable that ED visits peaked a week before the New York Times’ story about Elmhurst (the sole hospital in the zip code) being under siege.
U-Turn
Determined to get the data I wanted, I made a u-turn and headed back to the city health department (DOH) and public hospital agency (HHC) and submitted the same request to both: daily number of emergency department visits (for any reason) to Elmhurst Hospital Center in Queens, between 1/1/2006 and 12/31/2023.
DOH replied quickly and said, “The NYC Department of Health and Mental Hygiene doesn't have hospitals' records. Please contact NYC Health + Hospitals or Elmhurst Hospital Center directly.”
I responded,
Thank you for the quick response. I note that the data dictionary for this NYC DOHMH dataset says the following:
Patient visits to NYC emergency departments are reported to NYC DOHMH for surveillance of infectious and non-infectious diseases and conditions. Hospitals send files hourly or daily of every emergency department visit that include visit date and time, visit location, basic patient demographics including ZIP Code of residence, clinical information, and an indicator of hospital admission.
I interpret this to mean that NYC DOHMH has ED visit data for each hospital. Please advise if the data dictionary is incorrect.
I was then told I’d receive a response within 20 days, which I did, on 11 September 2024 — in the form of a denial:
“The New York City Department of Health denies your Freedom of Information Law request with the above-referenced control number. Records responsive to your request are exempt from disclosure pursuant to Public Officers Law § 87(2)(a) because they are confidential under state or federal statute. Specifically, in this instance the confidentiality provisions of § 11.11 of the NYC Health code apply, in addition to § 17-112 of the NYC Administrative Code.
Should you wish to contest this determination, you may submit a written appeal within 30 days of this message.
So DOH went from, “We don’t have those records” to “We have the records but they’re exempt from disclosure.” Worse, the statues cited do not appear to apply to the data I asked for or legally exempt the records from release.
§ 11.11 of the NYC Health code pertains to disclosure of records that could reveal individual identities or personal medical information. Releasing the number of daily visits to a public hospital emergency department would not create such a risk; the numbers are too high.
§ 17-112 of the NYC Administrative code says DOH “may establish reasonable regulations as to the publicity of any of its papers, files, reports, records, and proceedings.” I am unclear if the FOIL office of DOH is suggesting they are invoking a “reasonable regulation” in denying the requested records.
I did not file an appeal.
The response from HHC was a bit better but still insufficient. They sent monthly data for a four-year timeframe only and made unacceptable excuses for doing so.
“Please see attached ED visits from 2019 through December 2023. Kindly note that our electronic health record changed in 2019, therefore we can only provide data from 2019 onwards. Extracting data prior to 2019 from our legacy system would require writing sequel codes and the creation of a new record, which is beyond the scope of FOIL.”
Recall from the “Second Stop” earlier that HHC denied me daily ED visit data in January 2023 and said they only had a quarterly report. More than a year and a half later, they have monthly data but can’t provide anything before 2019 because it’s in a “legacy system” and access would require creating a new record. That makes no sense and is strongly suggestive of an attempt on the part of one or more persons to hide taxpayer-funded data from public view.6
To further illustrate the inconsistencies, HHC can apparently access 2019 files for monthly emergency department visit data but the 2019 death data is locked up. They were also able to provide 2016-2019 bed occupancy but not total staffed beds for the same period. These denials - plus a discrepancy between Elmhurst bed occupancy data from HHC versus data reported by the state - amount to flashing “warning signals” on an imaginary dashboard labeled OPERATION ELMHURST HOSPITAL and are reasons enough to doubt the veracity of what they’ve given me to date.
Course Correction: HHC Records Mismatch
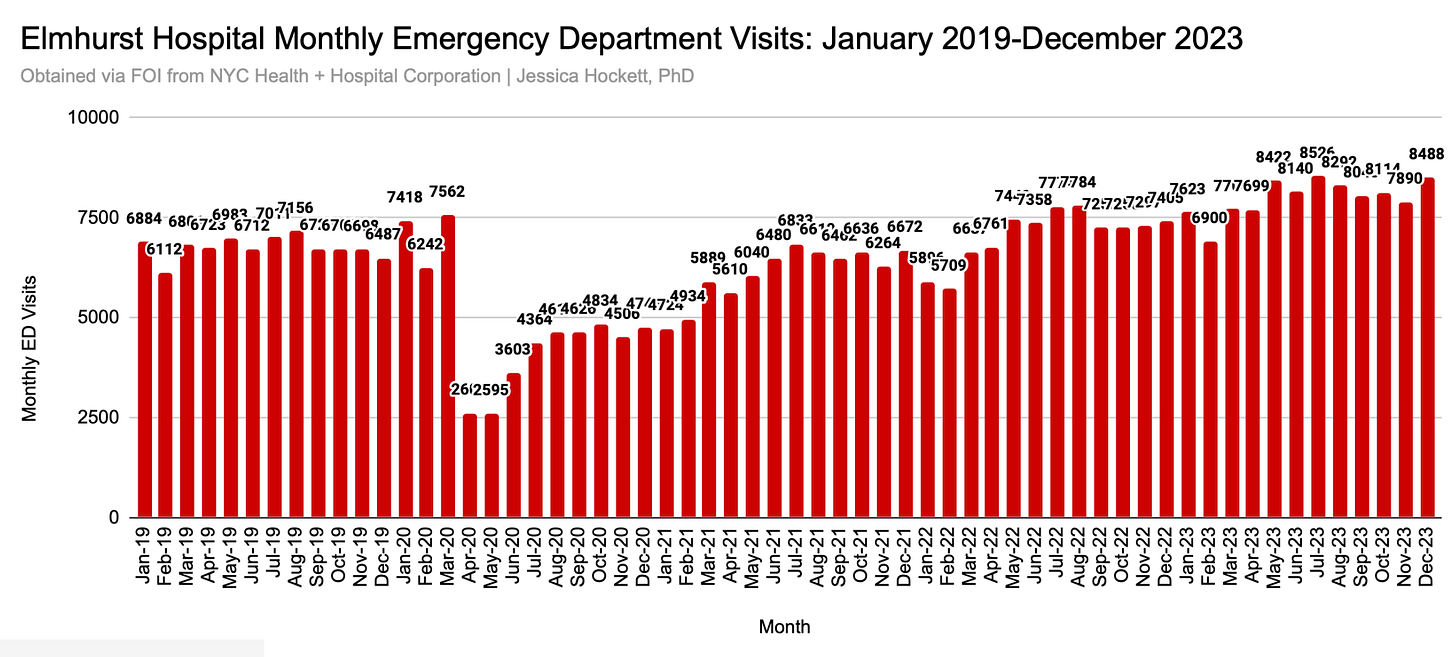
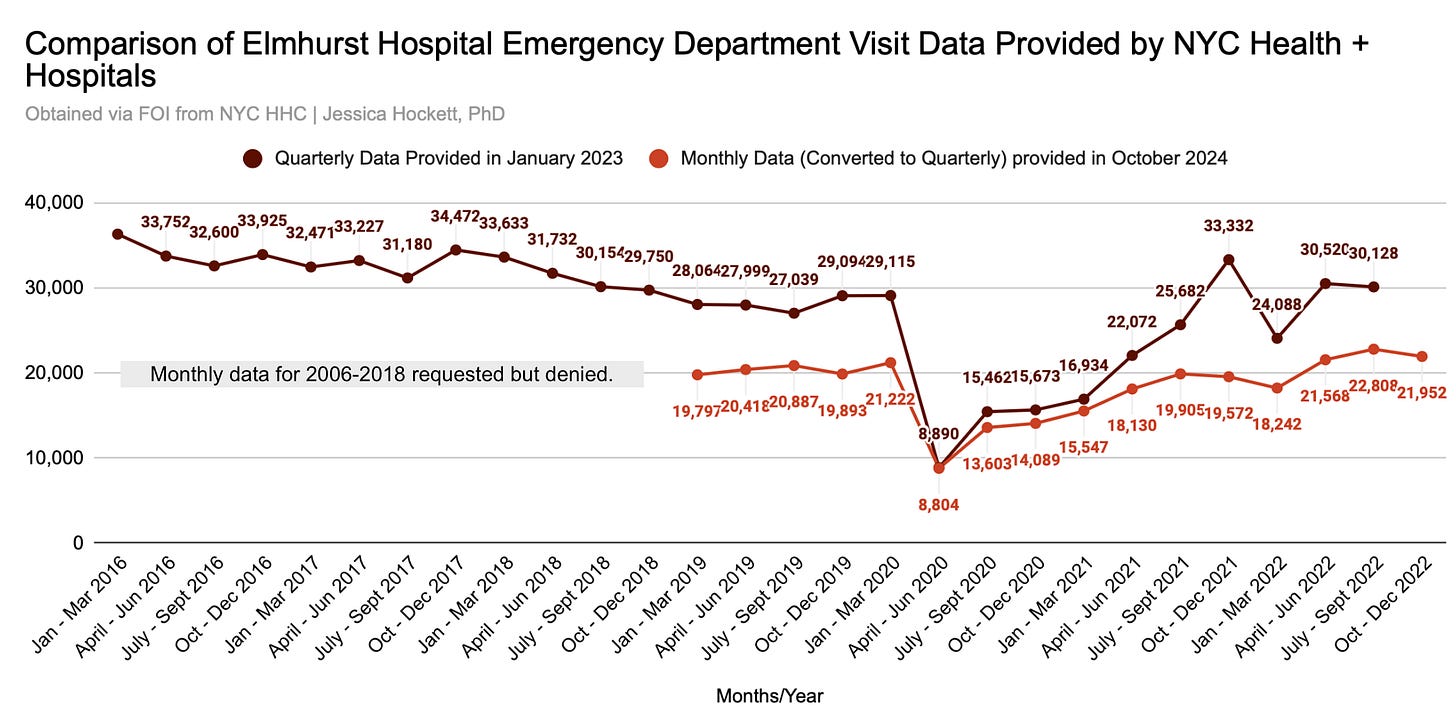
The monthly ED data I received from HHC a few weeks ago are shown in Figure 6. Because the years before 2019 were withheld, no comparisons between spring 2020 and 2017-2018 flu season or H1N1 event are possible.
Figure 6
March 2020 shows slightly higher visit levels than January 2020 (2%; 7,562 versus 7,418) and the same plummet and slow “recovery” observed in other data sources. Although it’s hard to say whether visits in 2023 are within a normal range without seeing the pre-2019 data, local and national media did not report last year that “epicenter” Elmhurst Hospital was being overrun with patients.
Importantly, I now have two sources for Elmhurst emergency department data from the same agency that can be compared: the 2017-2022 quarterly reports (Figure 3) and 2019-2023 monthly visits (Figure 7 below).7 We would expect the numbers to be very close, if not exactly the same. Unfortunately, they aren’t.
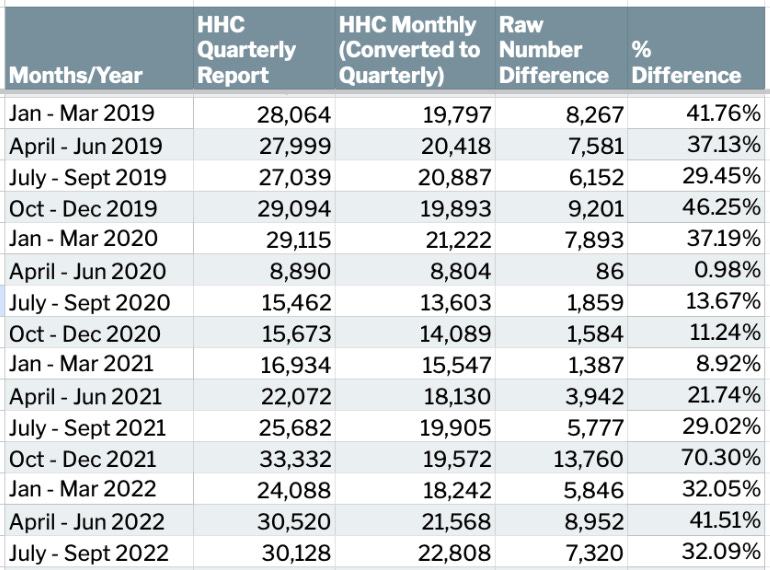
As shown in Figure 9, the respective quarterly totals are intolerably discrepant, with the exception of April-June 2020, which is nearly the same (0.89% difference; 86 visits).
Table 2 provides the raw-number and percent differences between the two sources in the quarters for which I was given data in response to my respective requests.
Figure 7
Table 2
It’s difficult to explain gaps of 9%-70%, or why the gap lessened for four quarters in a row before widening again. The difference for October - December 2021 is staggering, with the HHC quarterly report showing 13,760 more ED visits for Elmhurst than the monthly data HHC provided to me recently.
Besides manipulation, the best explanation I can think of for the discrepancies is that emergency department visit is defined differentially at one or more points in time. For example, the quarterly report defines ED visit differently from Jan 2019-March 2020, applies a different definition from April 2020 - March 2021, and yet another definition from April 2021 - September 2022. Changes to the definition could include or exclude visits conducted via telehealth or visits to a COVID “testing tent” that was set-up outside of the hospital.
“Are We There Yet???” (Back to Feldman et al)
No, we are not there yet. :)
We need to head back to Feldman et al study for a closer look at the numbers and description of what the hospital did.
For ED visits, the authors say:
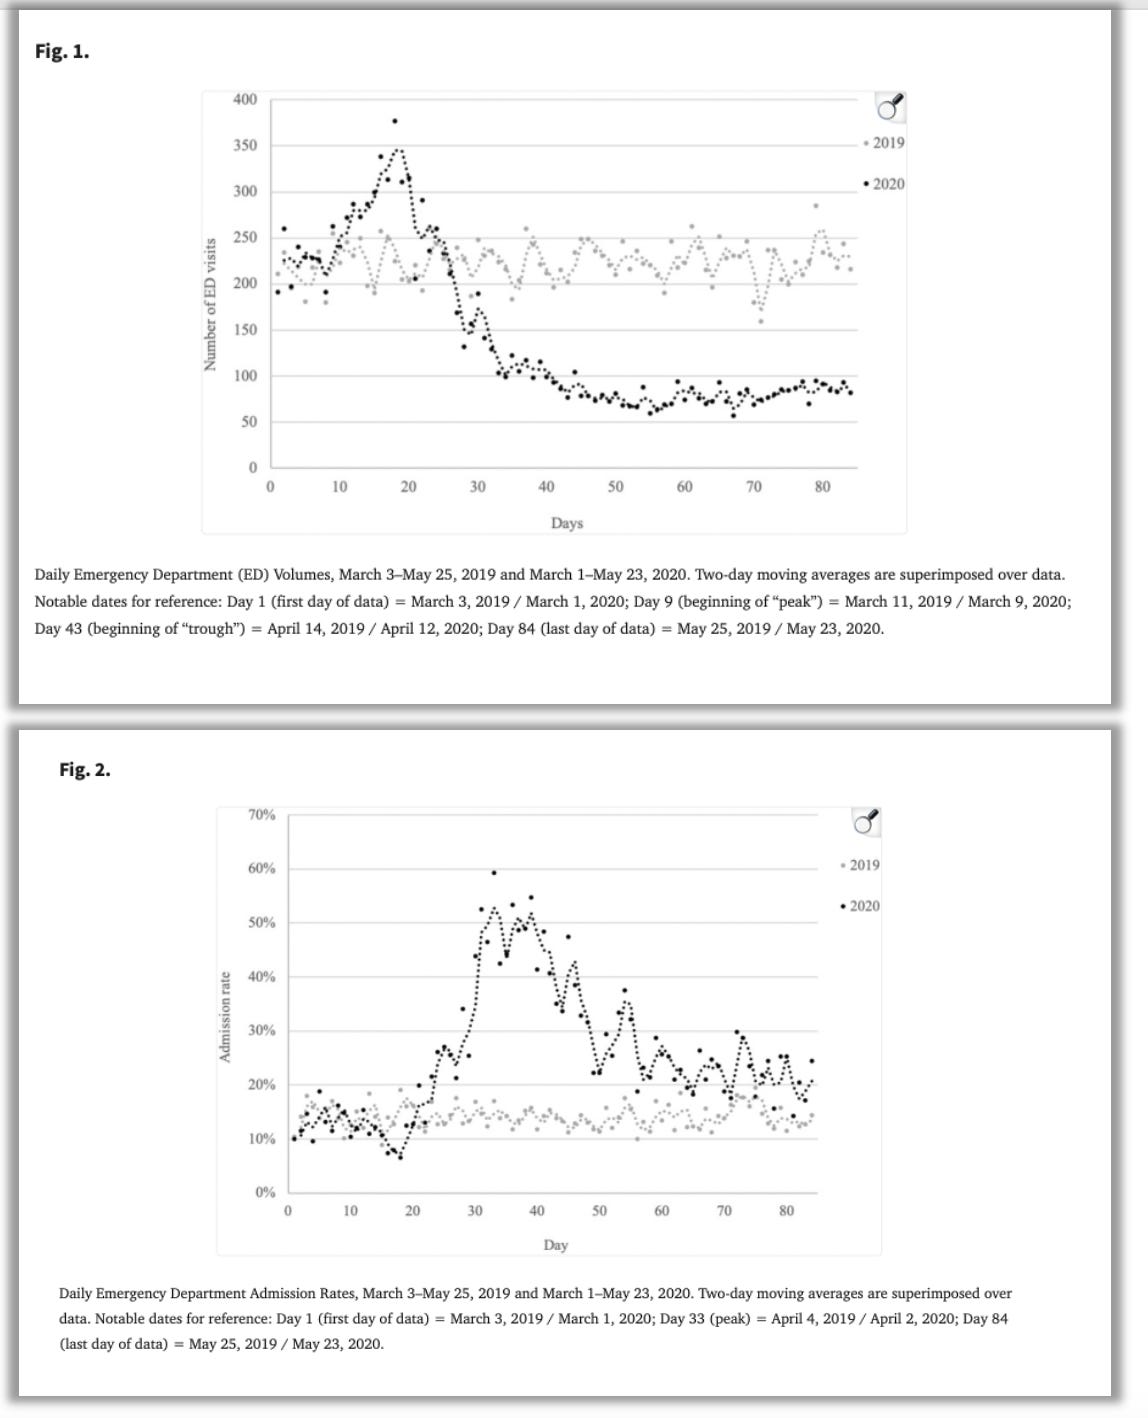
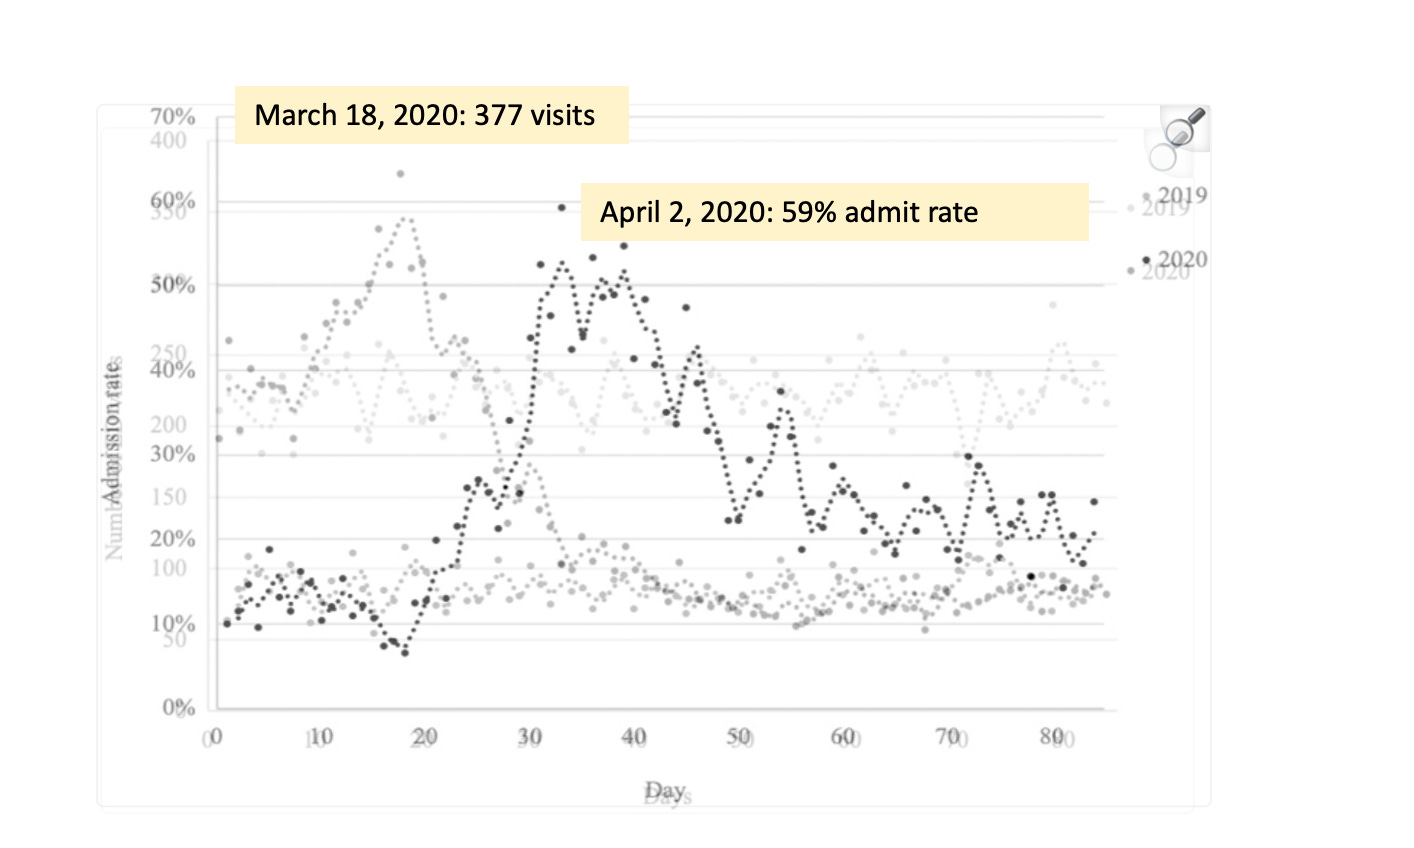
Volumes began to rise around March 9, 2020 compared to the corresponding dates in 2019. The daily volume peaked on March 18 at 377 visits, a volume 68% greater than on the corresponding Wednesday of 2019.8 After this peak, volumes declined, leveling off around the week of April 12. Between April 12 and May 23, the mean daily volume was 78.6, whereas during the corresponding time period in 2019 it was 225.3, representing a statistically significant 65% decrease (p < 0.0001).9
Feldman et al figure 1
Two “mitigation” strategies are described:
On 18 March 2020, a COVID-19 testing tent was placed at the ED entrance. When patients arrived, they chose the ED or the testing tent.
On 19 March 2020, “an ED provider” was stationed at the ED entrance to evaluate each inpatient coming into the ED.10 This person triaged some patients to the ED and other patients to “an alternate location for testing and/or treatment after a medical screening exam.” (It’s not clear what the alternate location or who was responsible for patient intake and evaluation, though it sounds distinct from the COVID-19 testing tent.)
Feldman et al say these mitigations contributed to “the rapid decline in reported volumes after March 18,” which implies that from March 18 onward, their figure 1 is showing only patients who entered the emergency department — not patients who were in the tent or alternate location. It also suggests the data from March 1 thru March 17 is patients who entered the emergency department in the physical hospital building. If that’s the case, it supports the idea that discrepancies between HHC’s quarterly & monthly ED visit data (shown earlier in table 2) could involve exclusion/inclusion criteria for what constituted an ED visit.11
Because the authors fail to provide a substantial baseline and a full calendar year, the increase is divorced from any meaningful context. They say “the striking speed and magnitude of [the ED visits surge] serve as a warning as the pandemic spreads” but don’t comment on whether a ~50% rise in eleven days (base to peak) is typical or expected at other times of the year. They also don’t compare the rise and volume to winter-time, or to the H1N1 "outbreak” in 2009, or “bad flu season” of 2017-2018 - two periods during which triage tents were used.12
The scene presented in Feldman et al is very odd: ED visits start to rise after the pandemic declaration and peak two days after the federal “slow the spread” decree while admits remain normal (between 10%-20%), dip slightly, and then skyrocket to 60% as the ED visits hit bottom.13 Admissions to the hospital from the ED are low when visits are high and admissions high when visits are low. (Remember, this is all transpiring during an incredible death event involving the loss of nearly 500 patients in four weeks.)
Feldman et al acknowledge the “two-stage” trend and explain the first stage as “a combination of asymptomatic individuals requesting testing as panic about the pandemic spread, mildly symptomatic individuals seeking care for other respiratory tract infections due to worries about having COVID-19, and actual infections with COVID-19,” with mitigations contributing to the decline in visits. They speculate the second stage and reduced visit/high admit rates were impacted by the mitigation strategies and those who had delayed care arriving to the hospital sicker.14
Such explanations fit with what media and officials were saying at the time and what many researchers have supposed — i.e., a few hospitals excepted, the emergency departments of most facilities were far less busy than unusual because people obeyed government orders to stay home and/or were afraid of getting infected by the virus.
Was it ‘Panic’ and Fear?
In the past, I would've interpreted the data the same way as Feldman and colleagues. After reviewing other reports and data, my November 2024 self has a harder time with such explanations.
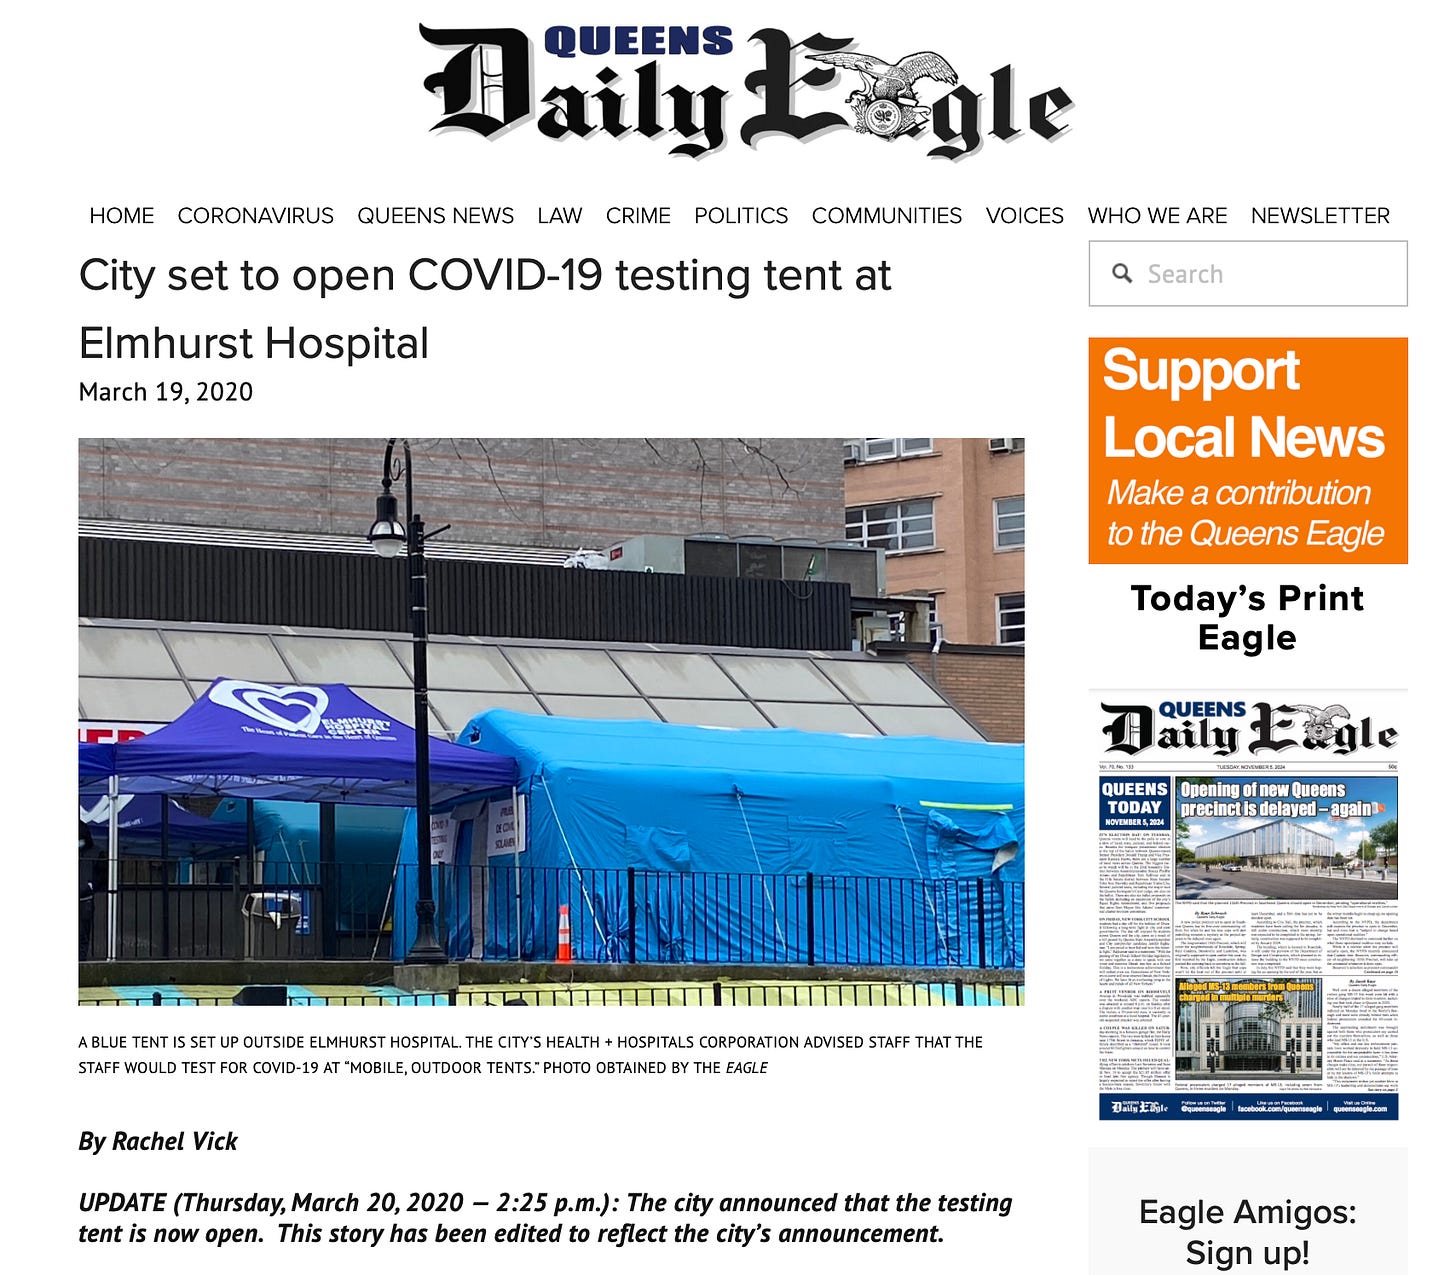
For example, details in a March 19, 2020 Queens Daily Eagle story about the timing and use of tents at Elmhurst and other hospitals paint a picture of relative calm versus an emergency in progress.
UPDATE (Thursday, March 20, 2020 — 2:25 p.m.): The city announced that the testing tent is now open. This story has been edited to reflect the city’s announcement.
The city has opened an appointment-only COVID-19 testing center in a tent outside Elmhurst Hospital as the number of confirmed cases of the illness in Queens rose to 980, the Mayor’s Office said Thursday.
The tent is one of 21 new testing sites, including ten at Health + Hospital Corporation locations, established by the city to meet the urgent need for illness identification and treatment.
“If we’re going to curb this epidemic, we need fast and expansive testing for those most at risk for serious illness,” said Mayor Bill de Blasio in a statement. “Now we can get more New Yorkers the care they need at the right time—helping save lives, one test at a time.”
Information about the tent was first outlined in an internal newsletter from Health + Hospitals Corporation officials to staff March 16 that was shared with the Eagle.
The hospital had not yet opened the test site, but a large blue tent was set up outside the hospital Thursday morning.
“To create and increase capacity for evaluating and testing patients for COVID-19, NYC Health + Hospitals is setting up by-appointment-only COVID-19 Assessment and Testing Centers in every borough to help accommodate New Yorkers who are referred for testing,” the internal newsletter said.
“The testing centers will be located in our hospitals and large Gotham community health centers and will be set up in a combination of traditional clinic space inside facilities and in mobile, outdoor tents,” the text continued.
In the same email to staff, HHC Chief Medical Officer of Ambulatory Care Andrew Wallach, MD, sought to remind healthcare workers about their vital role in stemming the virus, and quelling anxiety.
“Anytime there is an epidemic or a virus that quickly spreads, there is concern, but this is what we do,” Wallach added. “We are trained professionals.”
Patients who think they may have symptoms of COVID-19 will be instructed to first call the health system hotline, where a clinician screener will determine if the caller is an at-risk individual before directing them to next steps, according to the newsletter.
At the new testing centers, patients will receive a consultation with a primary care doctor to establish medical history, in order to better equip doctors to provide the best possible treatment in case the person tests positive for COVID-19, the newsletter states.
The newsletter advises that patients will need to call the health system hotline at 844-NYC-4NYC before getting an appointment. They can also call through 311.
Phone screeners will consider various symptoms that may suggest the caller has COVID-19, including a cough, fever and shortness of breath, as well as a history of recent travel to affected countries.
The COVID clinics will see health and hospital patients and people without a regular physician, and patients who come in for testing are asked to wear a face mask in order to minimize spread, whether they are diagnosed or not, according to the newsletter.
Nothing in the article says Elmhurst was experiencing high ED visit levels, which indicates the early March ED visit increase and March 18th peak shown in the Feldman study was neither unusual nor overwhelming. No copy of the March 16th internal Health + Hospitals Corporation internal newsletter is linked, but if the newsletter said any hospital’s emergency department was experiencing high volumes, the journalist surely would have reported it.
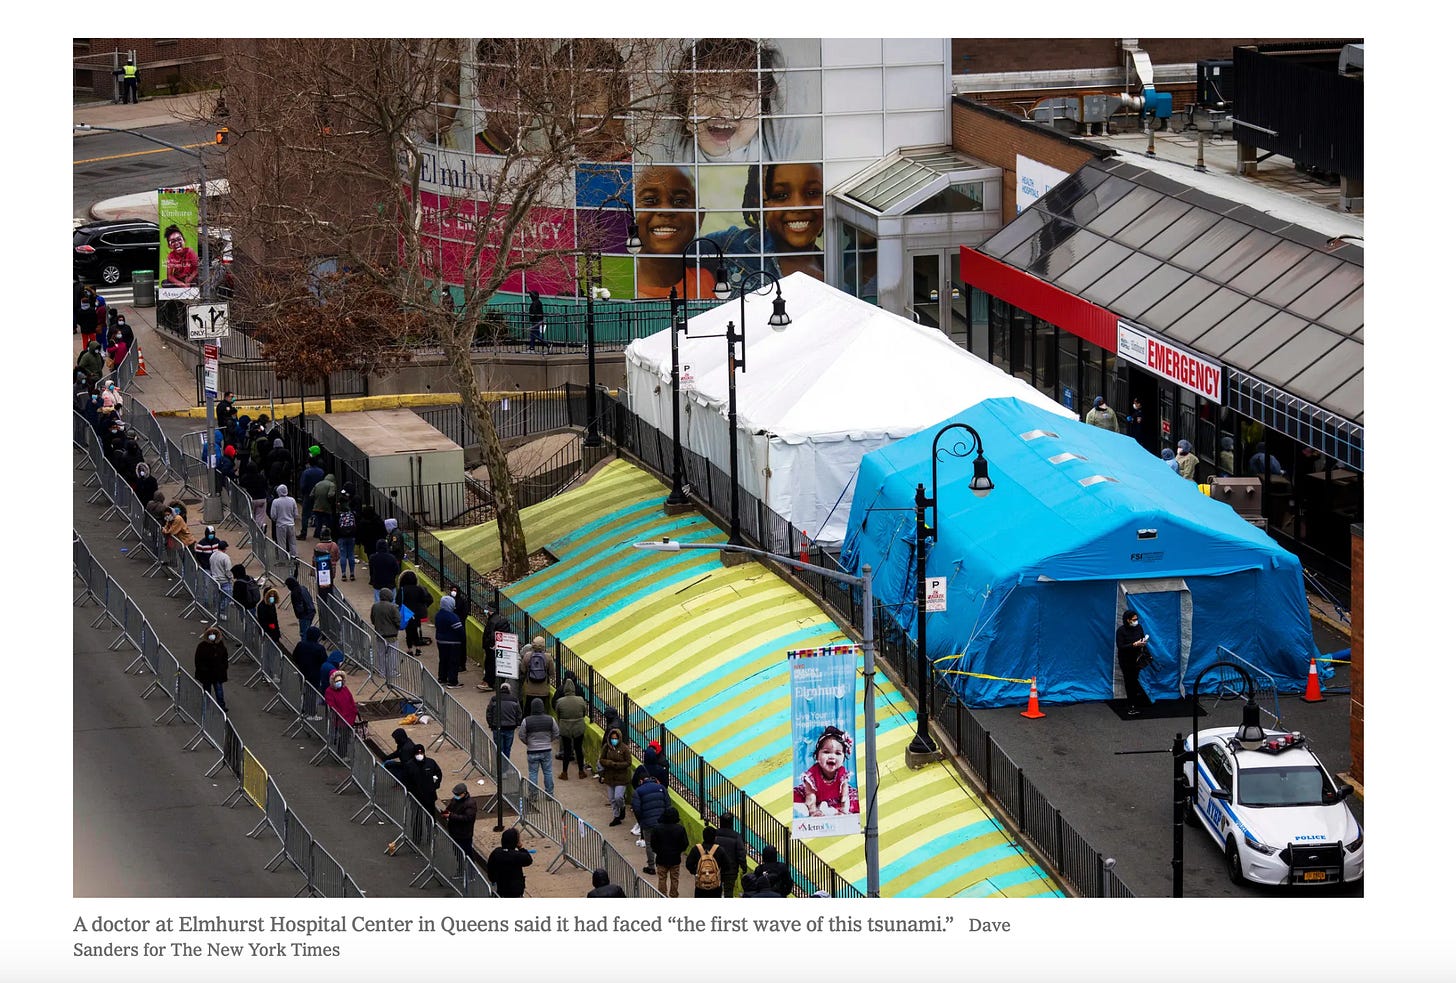
The article mentioned one tent at Elmhurst dedicated to COVID-19 testing “by appointment only,” opening on March 20th. The Feldman study implies there were two tents, erected to meet demand created by many sick and/or worried patients flooding the hospital, with testing in the tent beginning on March 18th. (The New York Times photo published the following week does show two tents in front of the Elmhurst emergency department entrance.)
Because the article directed New Yorkers to call and speak to screeners who could help them determine if they needed a test, it reads somewhat like an advertisement for testing and leads me to believe that videos & pictures of people lined up in front of Elmhurst days later were in part a function of successful marketing, rather than true mass panic.
It’s also hard to ignore that the decrease in ED visits citywide occurred simultaneous to an increase in 911 calls & ambulance dispatches, and a redirection of lower-acuity calls to telemedicine beginning April 1, 2020.15 These patterns contradict the perception that people were unwell but afraid to see a doctor, as most people who call for medical help expect that they or the person on whose behalf they’re calling could be brought to the hospital. Orders for paramedics to keep people away from (purportedly) overwhelmed hospitals - and to refrain from using normal lifesaving measures with patients in cardiac arrest - challenge Feldman & colleagues’ implication that the patients themselves were to blame for the drop in ED visits.
If we take the Feldman data at face value and think only about what it means from the perspective of admissions from the emergency department to inpatient, we’re left with an event that would certainly be incredibly overwhelming on the other side of the ED.
A baseline daily admit rate of 10-15% with visits in the 200-250 visit range means fewer than 40 admissions per day — a rate not exceeded at visit peak on March 18th.
When visits dropped to 100-150 per day, admissions climbed to far above 20%. Based on the figures and numbers provided in the Feldman study, let’s say there were 160 visits on April 2, when admits were 59%. That’s 94 admissions - almost triple the norm - simultaneous to day after day of double-digit deaths.
Whatever was actually happening in the Elmhurst emergency department, I’m left wondering why this event has not been subjected to a federal inquiry.
Dead End?
Due to uncooperative agencies and researchers, I’ve hit a “dead end” when it comes to obtaining a sufficient official time-series dataset for daily visits to the Elmhurst Hospital emergency department. It’s clear the ED wasn’t inundated with desperately ill or unprecedented waves of New Yorkers in need of medical care, but difficult to consider any dataset reliable amid so much obvious resistance to disclosure.
For first two weeks of the “COVID” emergency and long after, Elmhurst Hospital was presented to the world as ground zero of a disease outbreak. If, as some allege, the recently reelected Donald Trump was sold a false narrative about what was going on at the hospital in his hometown borough - or otherwise cares about what happened in the city that claims to have experienced a coronavirus bomb - then I look forward to his administration launching or ordering an investigation of the events inside the “epicenter of the epicenter.”
Next post in series:
All articles related to Elmhurst Hospital:
Elmhurst Hospital
Articles related to the events at Elmhurst Hospital Center in Queens, New York City, during the spring 2020 death event. Displayed in the order they were written.
Summary of serious problems with the NYC spring 2020 event:
A drop in ED visits in spring 2020 was observed across the U.S. and in other countries as well.
I reported this (incomplete) data in a Twitter thread in August 2023. Note that the name of the 11373 zip code neighborhood is also Elmhurst. See map.
I realized this after observing the average and peak in the zip code data is lower than the average and peak in the Feldman et al study. A graph of the data using the same timeframe and visualization as Feldman et al’s figure 1 is shown below. (For 2020, Day 1 = March 1, Day 33 = April 2, Day 61 = April 30, Day 85 = May 23) Both the city and the study show March 18, 2020 as the ED visit peak, but the zip code data shows 175 visits for that day, whereas the study shows over twice that number (n=377 visits).
Because my request to DOH said “daily emergency department visits in zip code 11373, from 1/1/2007 - 12/1/2023,” I had assumed the agency sent me ED visits occurring in the zip code.
I do not consider the H1N1 event a “pandemic” or disease spread event. Like COVID-19, it was a problem created for a vaccine solution. See related thread and article.
If legacy system sounds familiar, it’s because HHC gave a similar reason for denying 2016-2019 daily death data for their hospitals for and released only 2020. My appeal was unsuccessful. I wrote about the transactions here: New York City Public Hospital Agency Refuses to Release 2017-2019 Death Data.
There are also discrepancies between the monthly data from HHC and data reported in archived reports in the New York Statewide Planning and Research Cooperative System (SPARCS), accessed in 2023 and reported in Figure 10 in Does New York City 2020 Make Any Sense? and between SPARCS reports currently posted for Elmhurst and those accessed in 2023. I may come back to those discrepancies in another post. For now, it’s enough to say that myriad sources do not agree and may not be representing the same data or using the same definitions. UPDATE, 11/13/24 - I’ve now written about the discrepancies: https://www.woodhouse76.com/p/discrepancies-between-monthly-and
68% of 377 is 256, which would make the number of visits on the corresponding day in the previous year 121 - a level not shown on the 2019 graph line.
Pet peeve: Inappropriate use of decimals. What is a .6 ED visit? It’s like a .6 death. Round up!
Presumably this means a doctor or nurse employed by the hospital
Recall that I contacted the corresponding author for this study twice with requests for underlying data. After initially saying they would be “happy to share,” they did not reply again, so reaching out a third time with additional questions is unlikely to get a response.
Feldman et al: “The maximum admission rate occurred on April 2, when 59.22% of ED visits were admitted, a 249% increase over the corresponding Thursday in 2019. The admission rate then trended down through April and May but remained significantly higher on average than in 2019.”
This explanation could be corroborated by patient records but was outside the scope of the study.



Whoever wrote this was not close to the IT Dept:
"Extracting data prior to 2019 from our legacy system would require writing sequel codes and the creation of a new record”
It is SQL - Structured Query Language, not “sequel”.
“A new record” is just another line in a database that may already contain millions of records and so is gibberish in this context.
A small clue that the person writing this either had no idea about what was needed to produce the data requested, or was making up an excuse.
If in fact a SQL statement could have produced the data, then the database in fact exists. For a simple data extract, the statement may be very simple, like “select from (database) where...”.
They are either very incompetent or are deliberately putting you off.
Yeah as Mr Mccarville states the not able to access data is pure 10000% BS. Someone with passcode to legacy server will have access. They do not delete. I still have access to a previous eEMR at one of my rehab places even though we've been to new EMR for >2 years. Can still run reports from that time. They don't have to "write new code" but simply find IT data person with access to legacy server-that is it.