
Discrepancies in New York City Influenza-Like Illness (ILI) Syndromic Data Obtained from the City Health Department in 2020 and 2022

There are significant discrepancies between the flu surveillance data reported in a June 2020 study by Justin Silverman, Nathaniel Hupert, and
, and data I obtained in 2022 for the same variables. Both datasets were sourced from the New York City Department of Health & Mental Hygiene (NYC DOH).Sources
In their study, Using influenza surveillance networks to estimate state-specific prevalence of SARS-CoV-2 in the United States (Silverman et al., 2020), the authors used data on emergency department visits for influenza-like illness (ILI) and admissions for ILI to estimate excess ILI in New York City.1
After obtaining the same data over the same time-frame from NYC DOH in 2022, I reached out to Drs. Silverman and Washburne for the underlying data used in their analysis. They responded promptly and directed me to Dr. Silverman’s GitHub repository.
Data
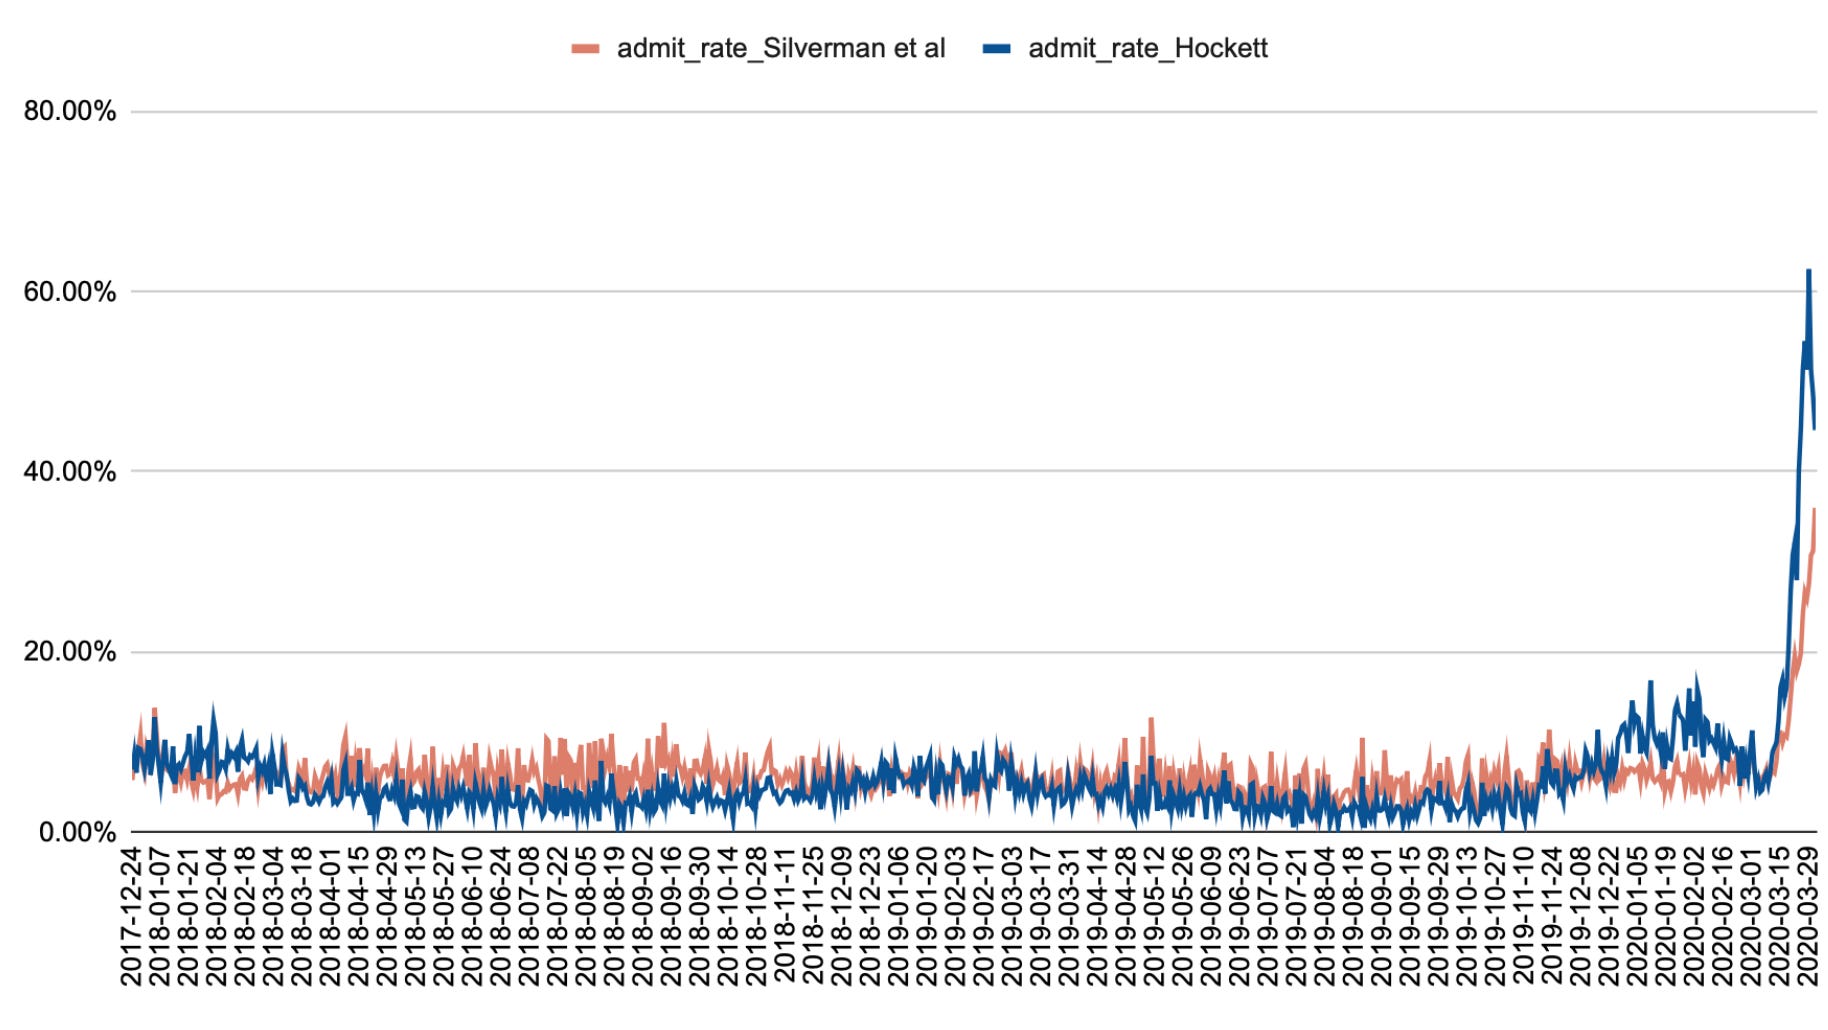
Figures 1 and 2 compare the data used by Silverman et al. in 2020 with the data I received. While the differences in ILI admission data are minimal, there are significant discrepancies in the timing and magnitude of the ILI emergency department visit datasets. Notably, these discrepancies are not confined to the 2020 period but extend to the middle of the 2017-2018 flu season. As a result, the differences in ILI ED visits lead to varying admit rates, shown in Figure 3.
Figure 1: NYC ILI ED Visits, 24 Dec 2017 - 1 April 2020: Silverman et al (2020) versus Hockett (2023)

Figure 2: NYC ILI Admissions from ED, 24 Dec 2017 - 1 April 2020: Silverman et al (2020) versus Hockett (2023)

Figure 3: NYC ILI Admits Rates from ED to hospital (ILI Admissions/ILI ED Visits), 24 Dec 2017 - 1 April 2020: Silverman et al (2020) versus Hockett (2023)
I prefer to discuss and attempt to resolve the conflict with Dr. Silverman, rather than further describe or speculate about the possible reasons for the conflict. If the ILI ED visit data we each received employs different operational definitions, the discrepancies may be resolvable or the result of error on my part. If they are not, we may be able to compel an explanation from the city health department.
I contacted Dr. Silverman and Dr. Washburne this weekend but have not yet received a response. I document the discrepancy here as a matter of public interest and part of my dedicated inquiry of what happened in New York City in spring 2020.
Other Discrepant Data Related to the New York City Mass Casualty Event
This is not the first or only instance of discrepant data related to the New York mass casualty event. Other examples include:
The timing and magnitude of deaths in New York City public hospitals,
The number of New York City COVID deaths occurring at home as reported by state and federal sources
Data discrepancies are not the only issue surrounding the event in which officials claim an additional 27,000 deaths more than normal occurred. Eleven “sets” of serious problems challenge the government narrative about what transpired and why:

The massive spike in fatalities in New York City over a very short period appears to be, in part, the result of data engineering and closely mirrors a similar, staged event in Bergamo, Italy.
UPDATE: 30 Aug 2025
I never heard from Justin Silverman or
.