
Comparing Milan 1630 and Bergamo/NYC 2020: Absence of expected stochasticity is a fraud signal regarding the latter

In this article, I capture the essence of observations I made last week of data reported in A spatiotemporal reconstruction of the 1630 plague epidemic in Milan (Galli et al, 2023).

My main interest in the study lies not as much in the spatiotemporal aspect (video below) as it does in the shape and behavior of the daily all-cause mortality (ACM) curve before, during, and after the excess death weeks.
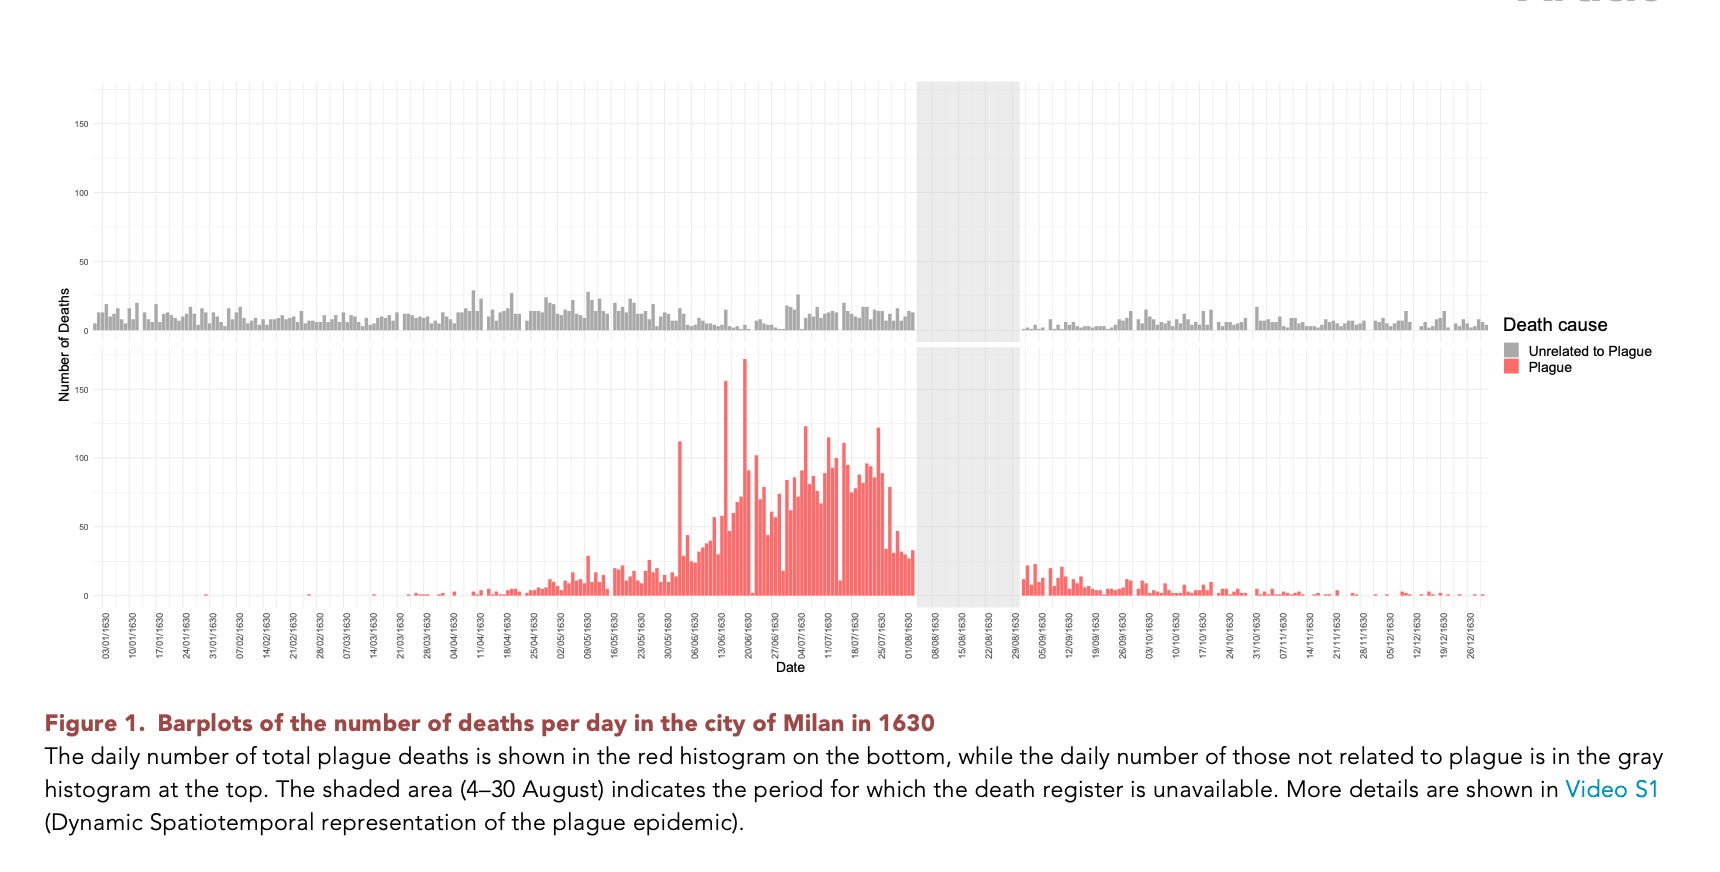
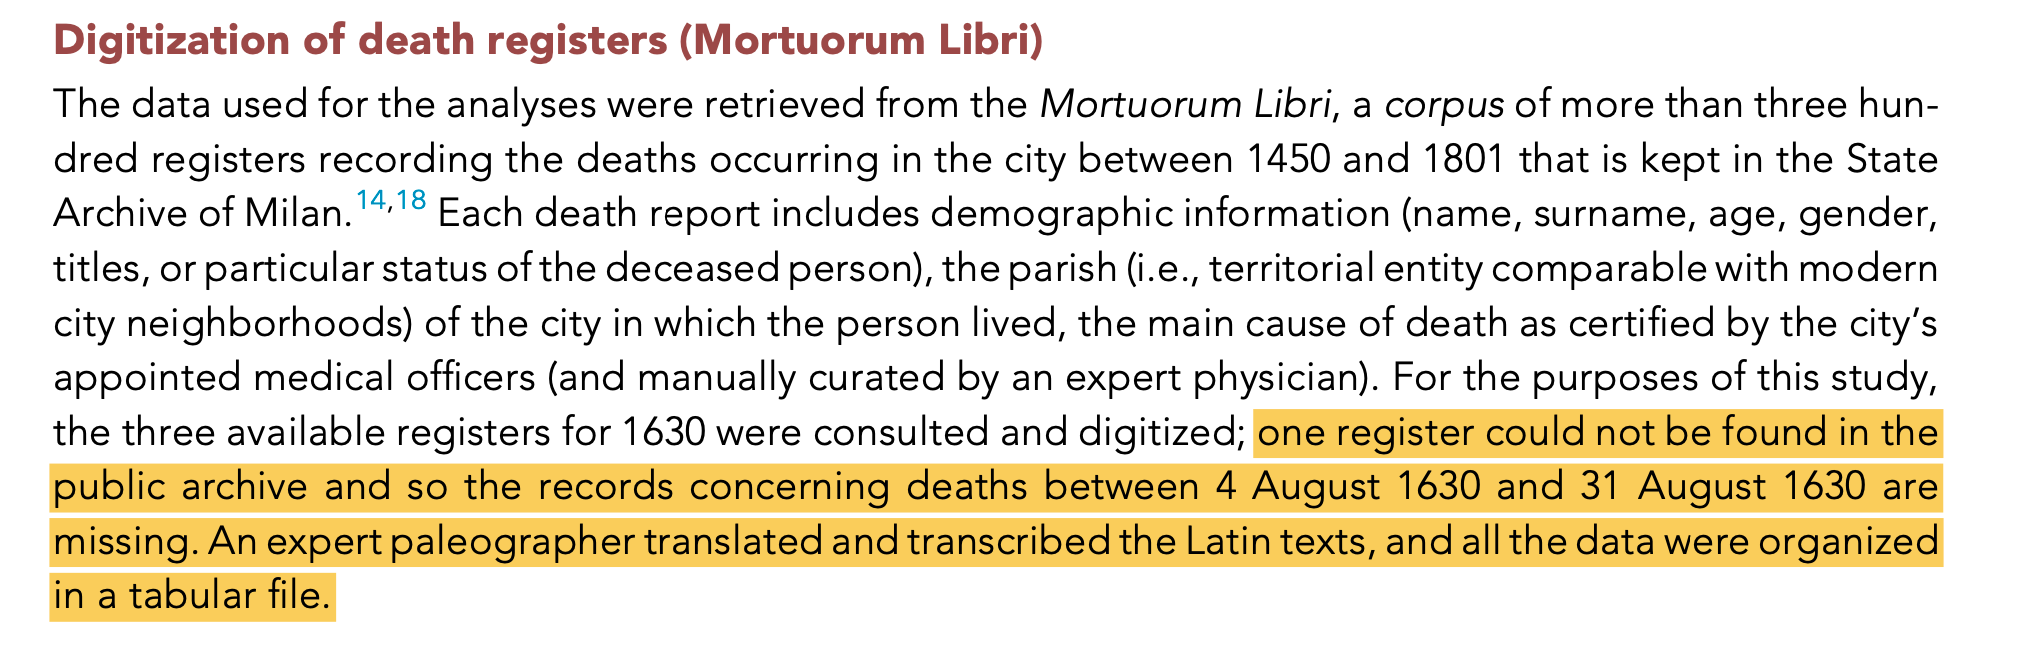
Unfortunately, the data are incomplete. Records showing deaths in hospitals and convents were not preserved or were not available. One register couldn’t be found in the public archives, so most of August is missing.

However, a complete dataset isn’t needed for visual comparison with the Bergamo and New York spring 2020 event curves — both of which I suspect are manipulated in magnitude, timing, or both.1
What stands out about the Milan 1630 curve (below, reproduced with data from the study) is its organic shape and stochasticity. It's full of noise, fluctuation, and variation across days of the week. It simply looks natural, even if the driving forces were more social and political than biological. Note as well the more gradual increase, akin to a fire building, as
observed should have been the case (but is not) in Lombardy, Italy, in early 2020.

Bergamo and New York, by contrast, shoot up in bomb-like fashion, as though something was dropped or fell from the sky, repeatedly. The steep, uninterrupted climbs — 12 consecutive days in Bergamo and 16 in New York — defy precedent. Events like flu waves, heatwaves, cold snaps, power outages, earthquakes, and hurricanes simply don’t produce death curves like these.2 The Paris 2003 heatwave is not an exception; nor is New York City’s 1918 curve (shown below).3

I reject 2020 as a “pandemic” caused by a spreading SARS virus but would like to define parameters for a purely iatrogenic event, in order to “test” suspect curves and to set an upper bound on iatrogenic spikes, because I doubt they are boundless. As reference points, I’ve used Chicago (pop. 2.7 million) and DuPage County (pop. ~930K). Both exhibit the expected variation when graphed alongside Milan 1630.


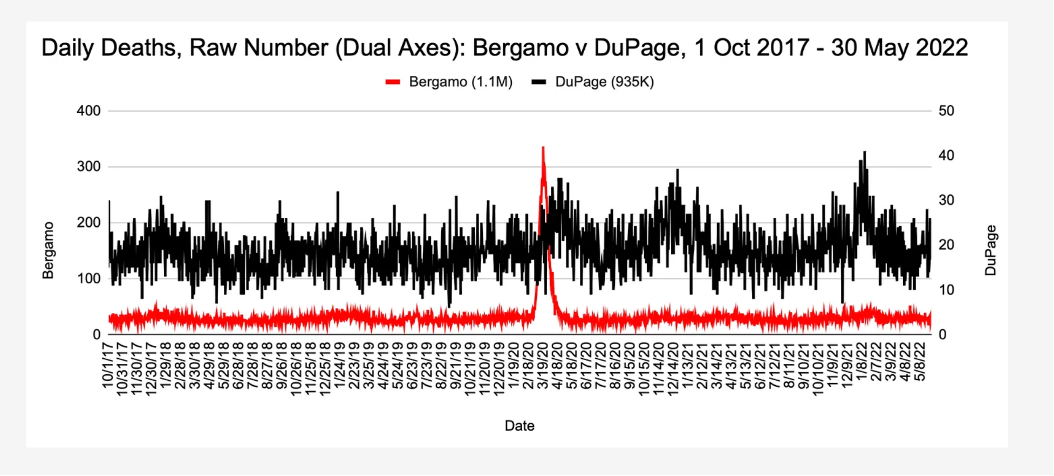
The audacity of the Bergamo and New York rises is hard to explain when set against Chicago or DuPage. As I’ve explained previously, differences in density, climate, or demographics aren’t good excuses.

The bottom line is this: The absence of expected stochasticity on the “front end” of the Bergamo and New York events should be regarded as major red flag and fraud signal. Even with incomplete data, the storied Milan Plague of 1630 appears to have a more plausible shape.
To the extent that the “climbs” of daily mortality curves in other locations exhibit similar characteristics as Bergamo and New York - whether in spring 2020 or thereafter - they also should be regarded as highly suspicious and in need of substantiation with public death records.4 Statisticians in particular should be concerned about the possibility of manufactured death data being used to model, portend, and plan for impossible events.

Several additions and revisions made soon after publication on 15 July 2025 clarify and expand upon original points without altering their substance. Last edits made 16 July 2025.
Related:
Also mentioned under Problem 3: https://www.woodhouse76.com/p/eleven-serious-problems-with-the
I am suspicious of the 1918 curve too — and have questions about what all was involved in the digitization of the death certificates underlying the data. Nevertheless, even adjusted for population, the autumn 1918 New York event curve is not nearly as suspicious as the spring 2020 version.

Elsewhere I’ve identified London, NYC metro counties, New Orleans, Madrid, Manaus (Brazil) as candidates.
Okay, how does the image of the Bergamo/NY curve against the Imperial curve not raise eyebrows? Sure, sure. That's how life works right? We predict it in a model and then it plays out exactly like we predicted.
One of my favorite substack guys often used to end his posts with some topical bit of music or video. Here's a brief piece from a composer active in Milan in years before 1630 - he actually died that year - who knows, he may be a data point on that lurid, jagged blue data plot (well, jagged at least, can blue be lurid?) - doing his part for stochasticity - and passing on at what, at the time, would have been the grand old age of 60.
https://www.youtube.com/watch?v=fh9rBx0zV30
And by the way, just who gets a stochasticity citation? only guys dying on peak days? guys who hold on a few days more beyond the valley days and get to a mid-range day (thus accentuating the valley)?