

Three Cities, Same Virus?
Three Cities, Same Virus?
The spring 2020 daily death curves of Bergamo province, New York, and Chicago raise questions about whether the events can be reasonably blamed on sudden spread of the same pathogen.

Copy. Original post with reader comments posted in Chicago section.

As the events of late 2019 and early 2020 leading up to a pandemic declaration and societal shutdown continue to be debated, I offer a comparison of three places that experienced considerable excess death in the “first wave”:
Bergamo Province, Italy. The Bergamo province is one of a number of areas in the Lombardy region of Italy that experienced early and extremely high deaths. Jonathan Engler observed that the synchronicity of spikes in the region defy what would be expected of disease spread — which should look more like a forest fire igniting and building gradually than a fireball or bomb drop. In terms of percent increase, Bergamo and other provinces in the region are the only locations which exceeded New York City’s mortality in the spring 2020 period.
New York City. The focus of my ongoing inquiry, the speed and magnitude of New York City’s mass casualty event is a U.S. outlier and a global outlier insofar as excess deaths among younger adults in March and April.
Chicago, Illinois. Chicago’s Wave 1 death increase was much lower than Bergamo’s or New York’s - and started later - despite announcing a COVID-19 case 4-6 weeks sooner than the other two cities.
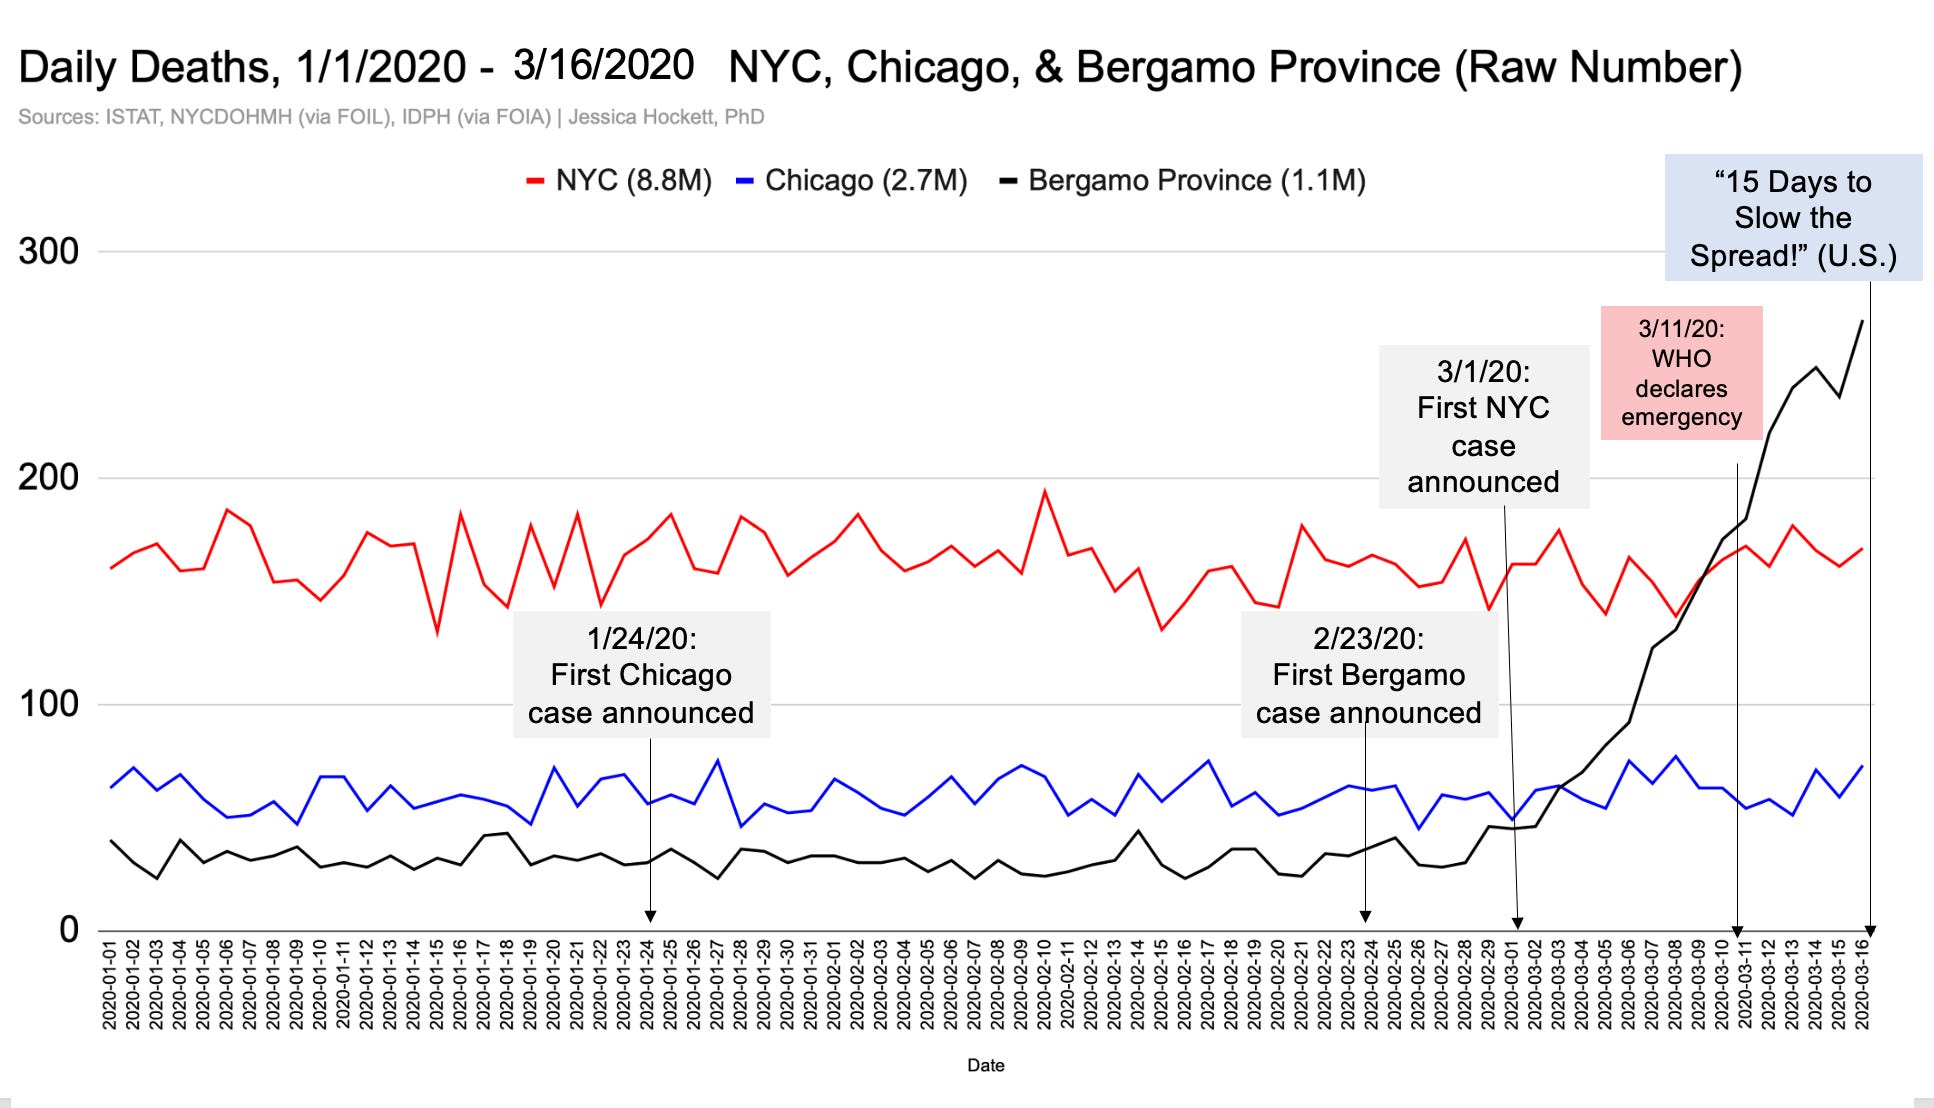
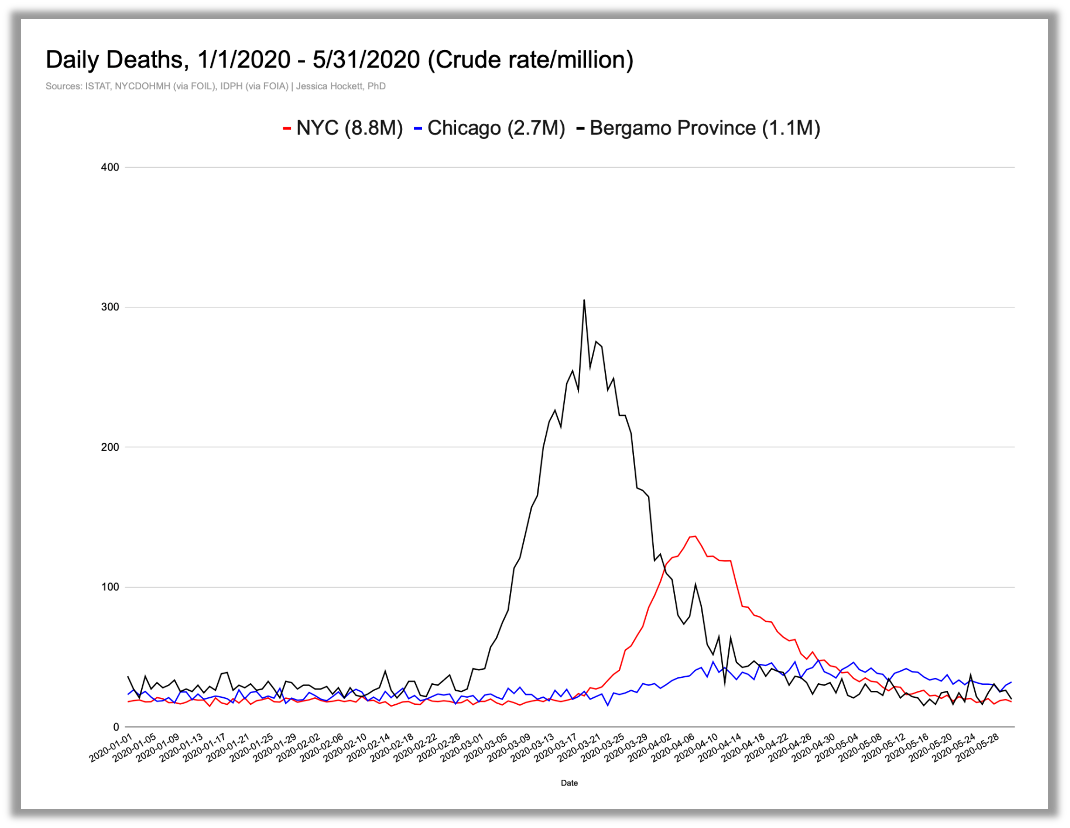
Daily deaths in Bergamo, New York, and Chicago from January 1, 2020 through February 23, 2020 are stable and show no signs of a spreading pathogen or particularly severe flu season. Chicago announced its first COVID-19 case on January 24th; Bergamo’s was a month later

Bergamo’s deaths start to take off pretty quickly.1 New York announced its first case on March 1st, but deaths there and in Chicago stayed normal until after the U.S. announced “15 Days to Slow the Spread” is announced.
New York starts to rise on March 18th or so and skyrockets to a 1,200-death peak on April 6th.
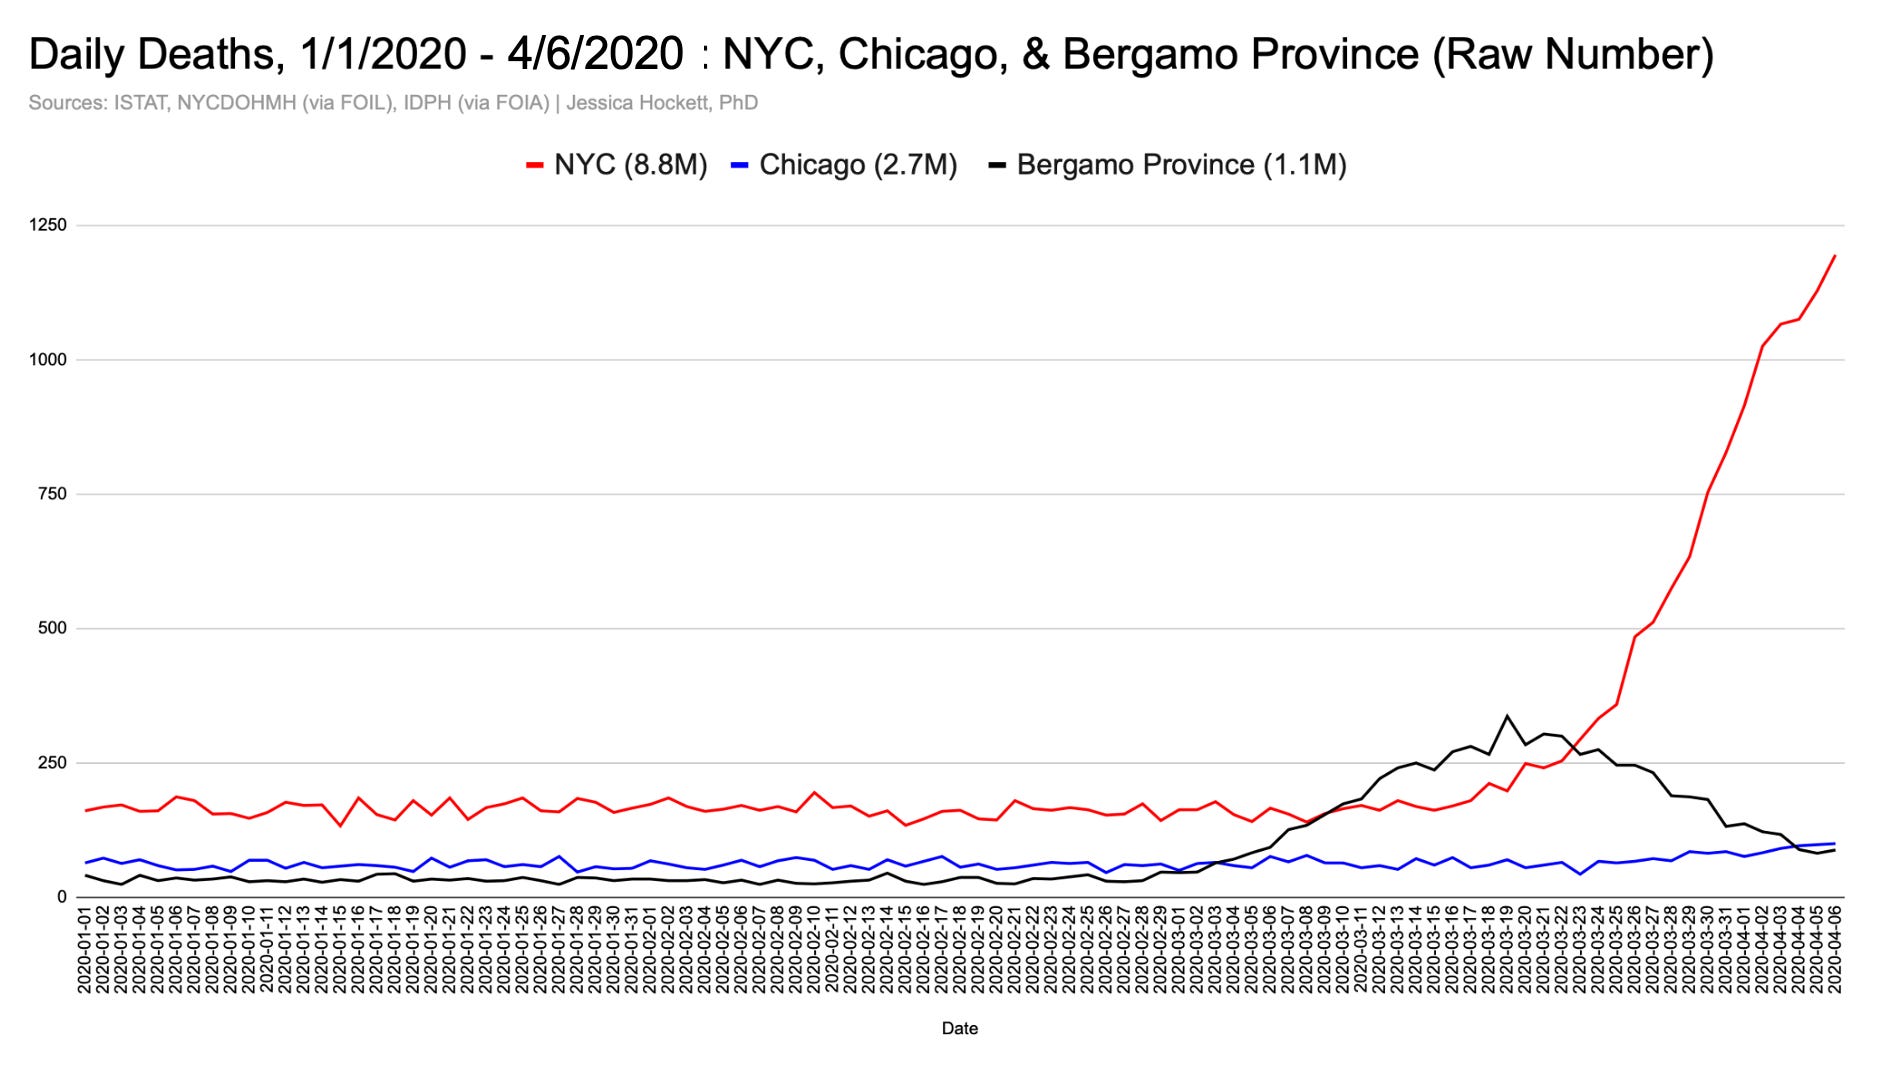
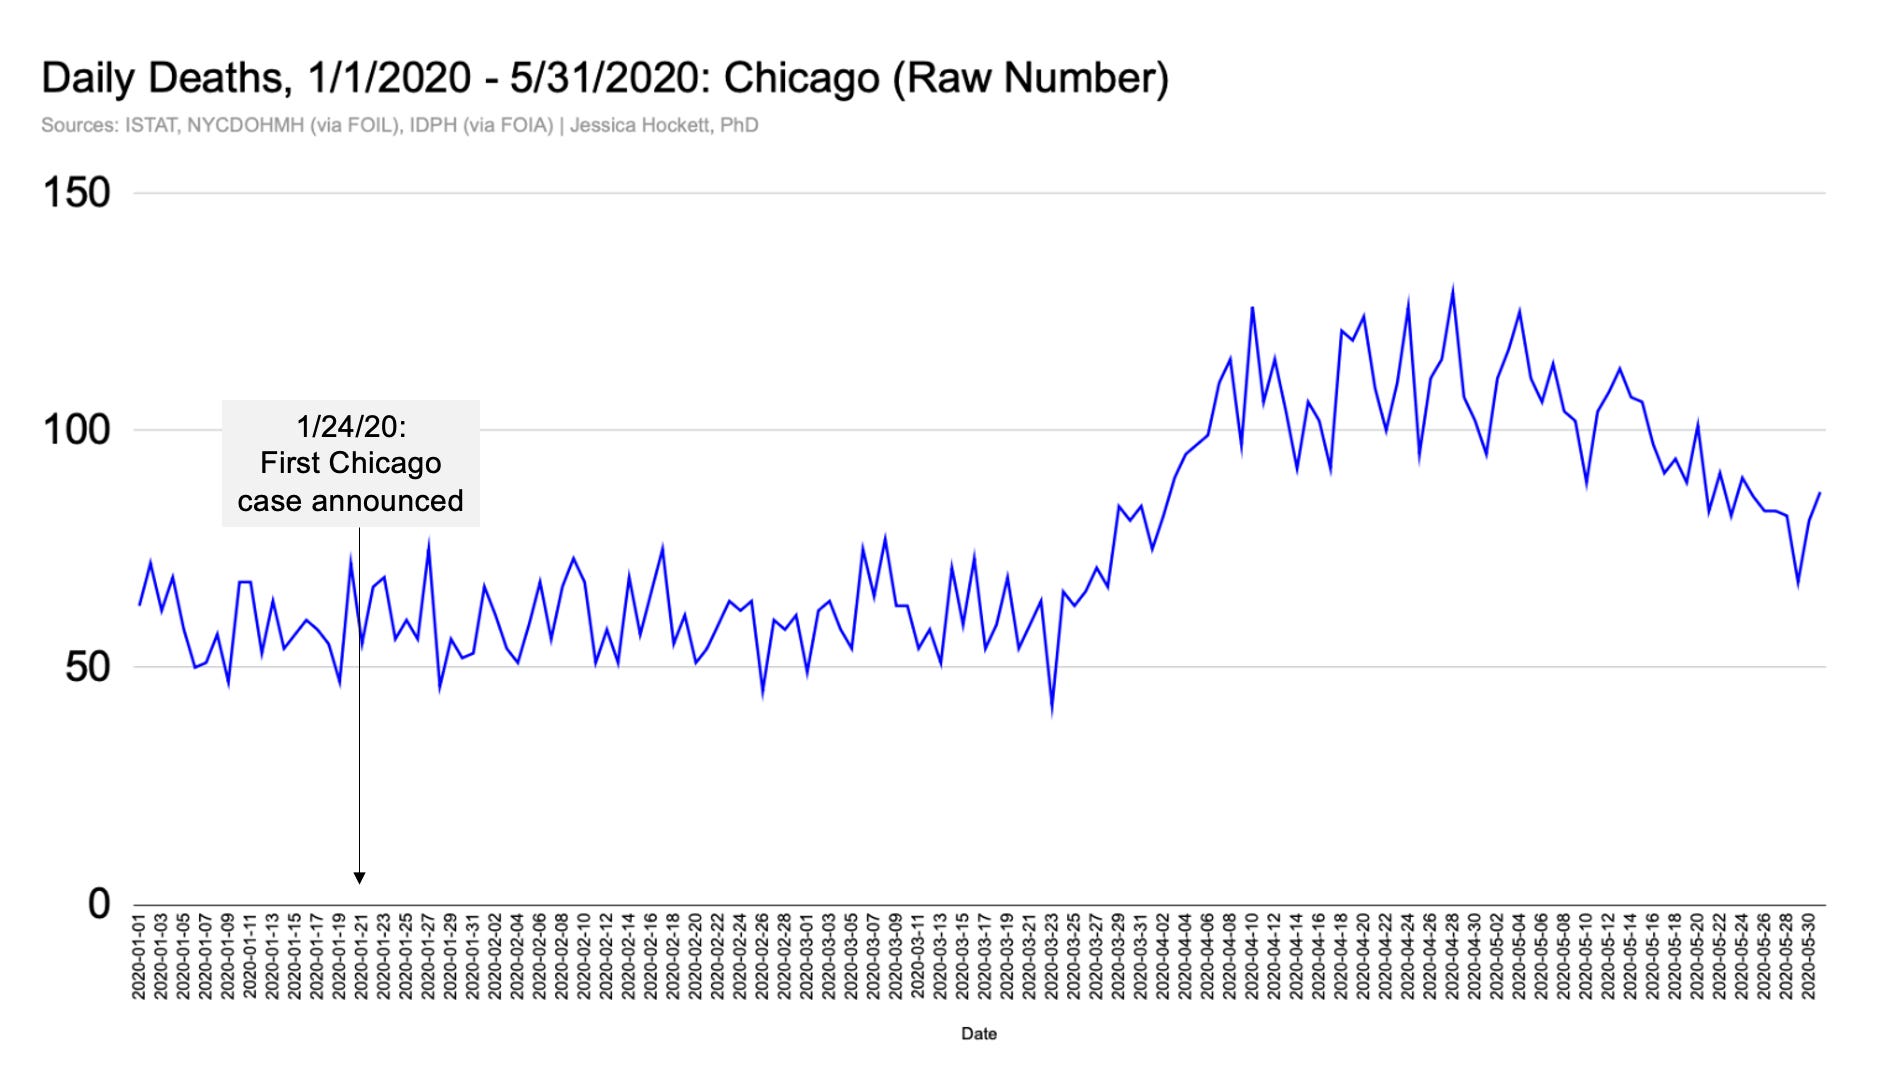
Chicago had a slower start, with daily deaths beginning a climb to a much lower peak during a more drawn-out event.
Daily deaths for the three places from January - May 2020 present a curious picture of sequential events - as though all were “on their mark” and “set” but were given different orders to “go!”.

Bergamo “wins” the prize for highest percent increases in daily deaths, from pre-event average to event peak, at nearly 1,000%. New York had 26K-27K “extra” deaths2 in their wave, with a shorter rise to peak than Bergamo.
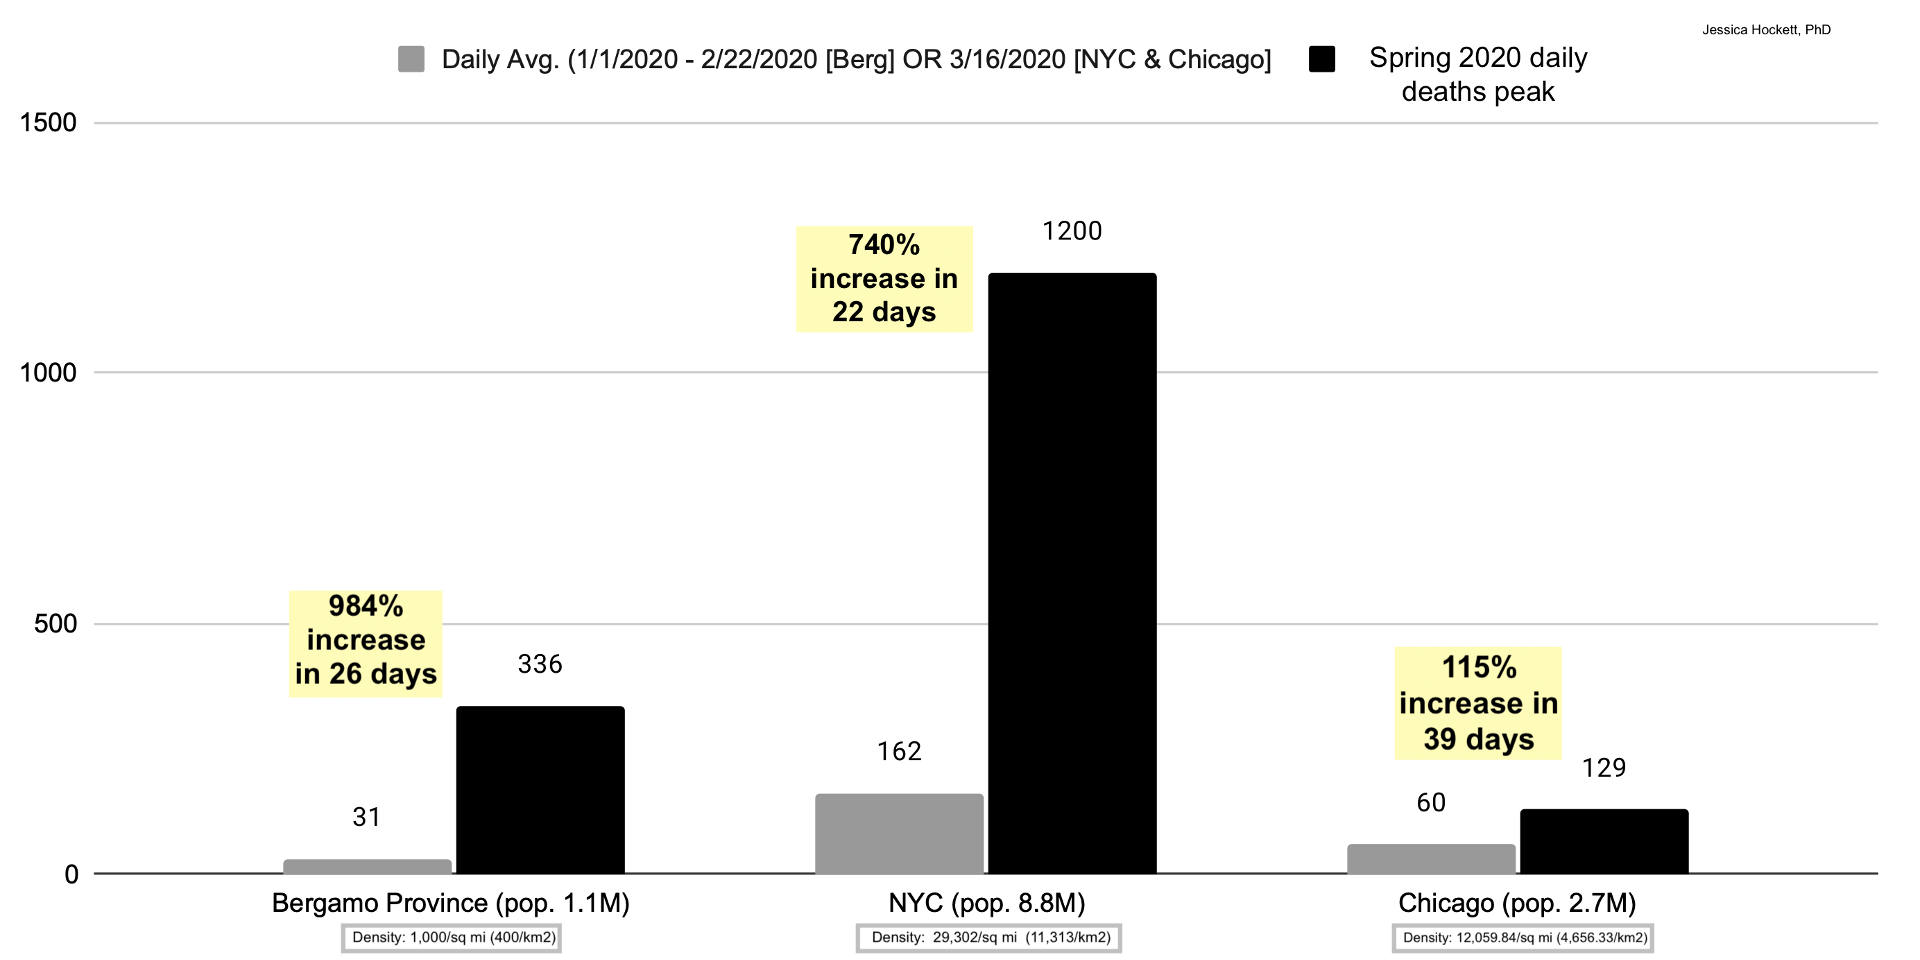
Chicago came nowhere near New York in percent increase and took much longer to peak. Note that Chicago isn’t as population-dense as New York but is much denser than Bergamo (and detected a case sooner than Bergamo). Like New York, Chicago is an international travel hubs, with daily flights to and from Asia, Europe, etc.
People point to New York’s subways as a vehicle for sudden spread, but Chicago has subways - and buses and trains and a major international airport with daily flights to China - too. Bergamo’s population is not dependent on the same kind of public transportation network, as far as I know.
Yet Bergamo had the highest crude rate per million by a long shot, even as southern Italy remained relatively unscathed.
I’m left wondering how these events could involve the same “spreading” virus? What is the explanation for the differential "impact" of the purported novel deadly pathogen on daily deaths in Bergamo province, New York, and Chicago?
Doesn’t an explanation for Bergamo and New York, at least, require ascribing characteristics to a pathogen that
a) weren't observed elsewhere or ever again, and
b) haven't been observed with any pathogen, insofar as the ability to create mass casualty events?3
When should we assume “spread” in each of the three cities began, exactly? If this novel deadly coronavirus spreads so fast, then why did it take so long to impact daily deaths in Chicago? Why was the pathogen nowhere, until it was everywhere, as Todd Kenyon puts it — and deadlier in New York than on a cruise ship filled with elderly passengers?
Thanks in part to missing, discrepant, and downright unbelievable data for New York hospitals, I have to ask: Was there really NO excess death prior to government interventions and hospital testing – despite reports of a rather rough flu season4 and other factors5?
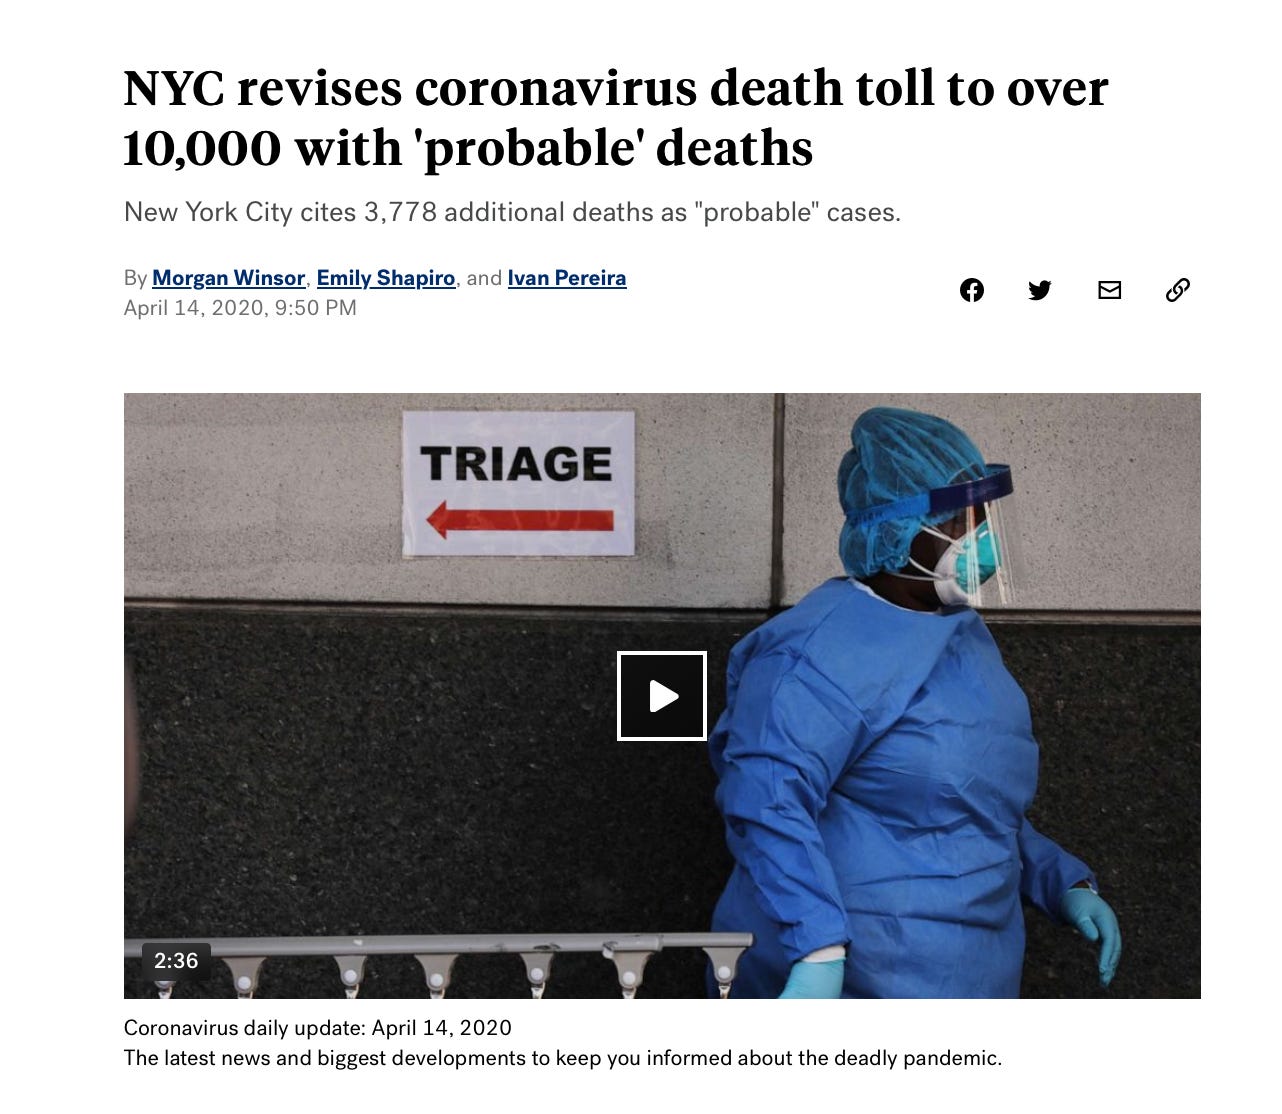
Could the speed and steepness of curves in northern Italy and New York include deaths that occurred earlier in February, January, or even December 2019 and were “pushed forward” into Wave 1 deaths, possibly under the auspices of being “probable” COVID-19 deaths? Where are the death certificates that can substantiate these events? Numbers in a public data file aren’t proof, especially when government officials use the numbers to justify revocation of liberties and harms to vulnerable populations (including children).
Fraudulent schemes would not mean that thousands of iatrogenic deaths didn’t occur in the spring weeks; rather, it would mean curves were tampered with and do not accurately represent deaths that actually occurred on each day (and only on one day and/or only in one place).
At minimum, we are left with what Nick Hudson recently described as
“…completely different places with similar population characteristics [that] experienced completely different mortality outcomes…differences could not be explained by viral dynamics. Something else was at work…
I concur:
Something else was at work - something that isn’t explained by sudden spread of a novel, risk-additive coronavirus from Wuhan racing around the world at lightening speed and — possibly — something else besides the myriad contributing forces and factors already known to have been at work, in Bergamo, New York, Chicago, and elsewhere.
UPDATE, 10/15/2023: See this thread for more of my thoughts and questions about Bergamo’s daily death data.
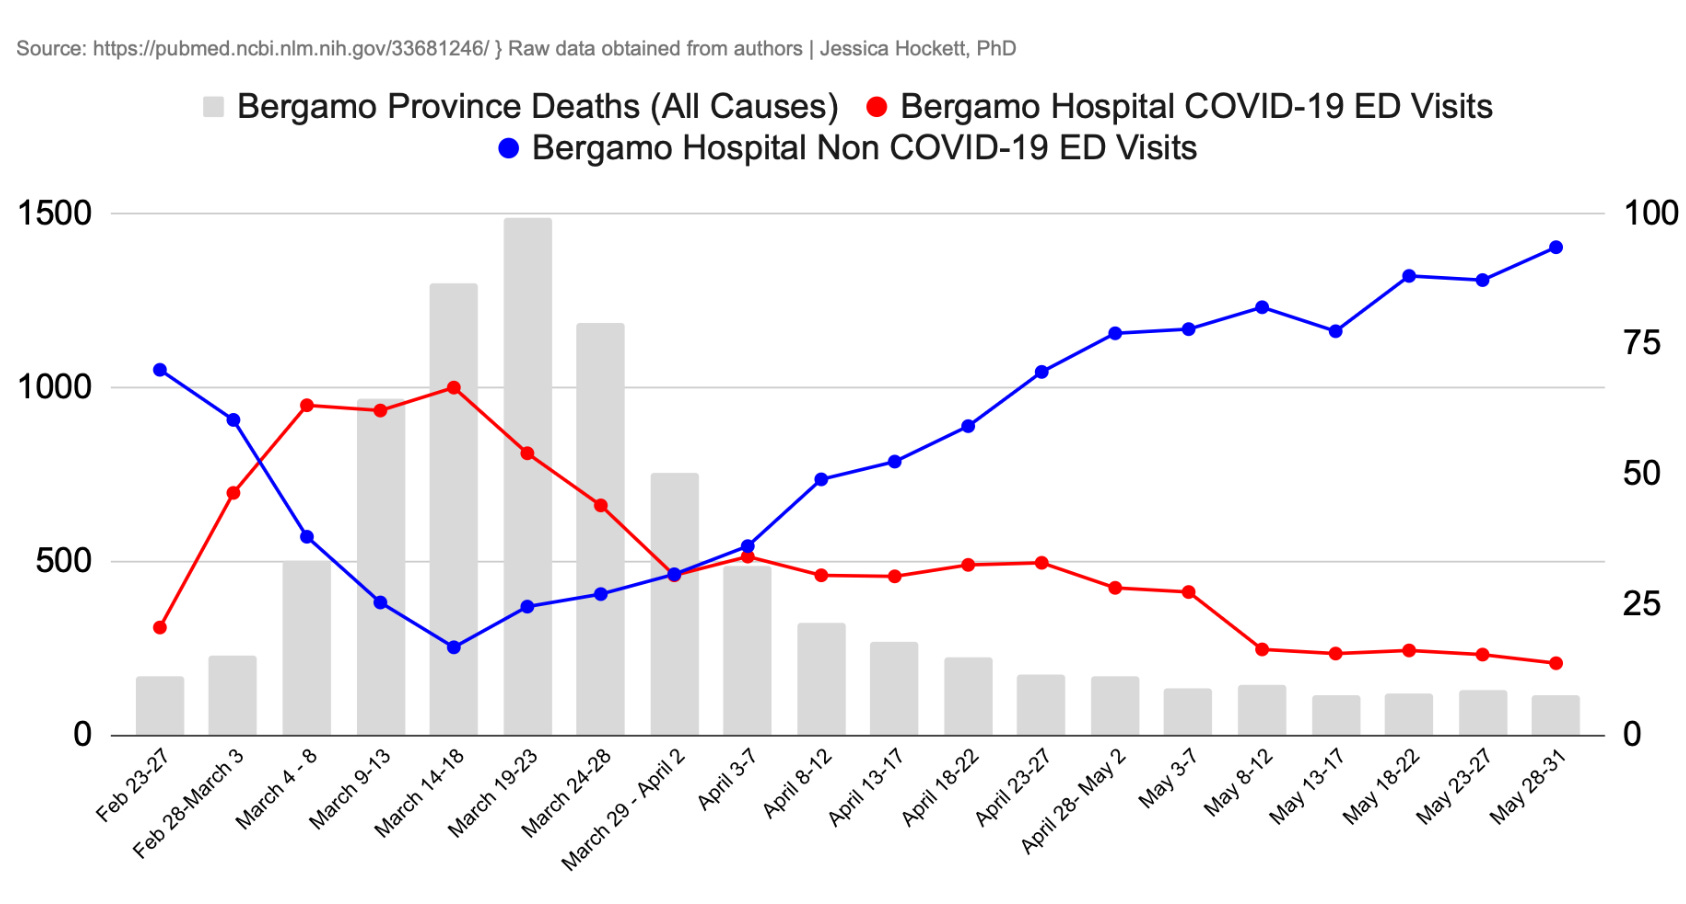
Data for Bergamo Hospital shows COVID cases in hospitals rose with the announcement of the first case.
Depending on source, i.e., city or federal.
SARS and H1N1 appear to be testing phenomena. Even 1918 isn’t a definitive example. (A recent HART Group Substack article summarizes nicely)
For example: https://web.archive.org/web/20191206132031/https://health.ny.gov/press/releases/2019/2019-12-05_influenza_is_prevalent.htm, https://www.cbsnews.com/news/flu-season-comes-early-this-year-due-to-unexpected-virus-cdc-says/